-- Friday, February 22, 2019, 22:35 --
|
Company Profile: |
|
CME Group Inc., through its subsidiaries, operates contract markets for the trading of futures and options on futures contracts worldwide. It offers a range of products across various asset classes, including futures and options based on interest rates, equity indexes, foreign exchange, energy, agricultural products, and metals. The company executes trade through its electronic trading platforms, open outcry, and privately negotiated transactions, as well as provides hosting, connectivity, and customer support for electronic trading through its co-location services. CME Group Inc. was founded in 1898 and is headquartered in Chicago, Illinois. |
|
Recent News: |
|
CME Group announced that John Pietrowicz, Chief Financial Officer, and John Peschier, Managing Director of Investor Relations, will present at the Citi 2019 Asset Managers, Broker Dealers & Exchanges Conference in New York on Wednesday, February 27, at 1:30 p.m. (Eastern Time). The company reported revenue of $1.2 billion and operating income of $650 million for the fourth quarter of 2018. Net income was $385.5 million and diluted earnings per share were $1.09. Total revenue for full-year 2018 was $4.3 billion and operating income was $2.6 billion. Net Income was $2.0 billion and diluted earnings per share were $5.71. |
|
|
 |
|
Fundamental Analysis: |
|
Ninestocks analyzes several different financial aspects: Growth, Profitability, solvency and efficiency. |
|
Growth – Measures the growth of both the company’s income statement and cash flow. @@@@@ |
|
Profitability – Measures the historical price movement of the stock. @@@@@ |
|
Solvency – Measures the solvency of the company based on several ratios. @@@@@ |
|
Efficiency – Measures the strength and historic growth of a company’s return on invested capital. @@@@@ |
|
Conclusion: |
|
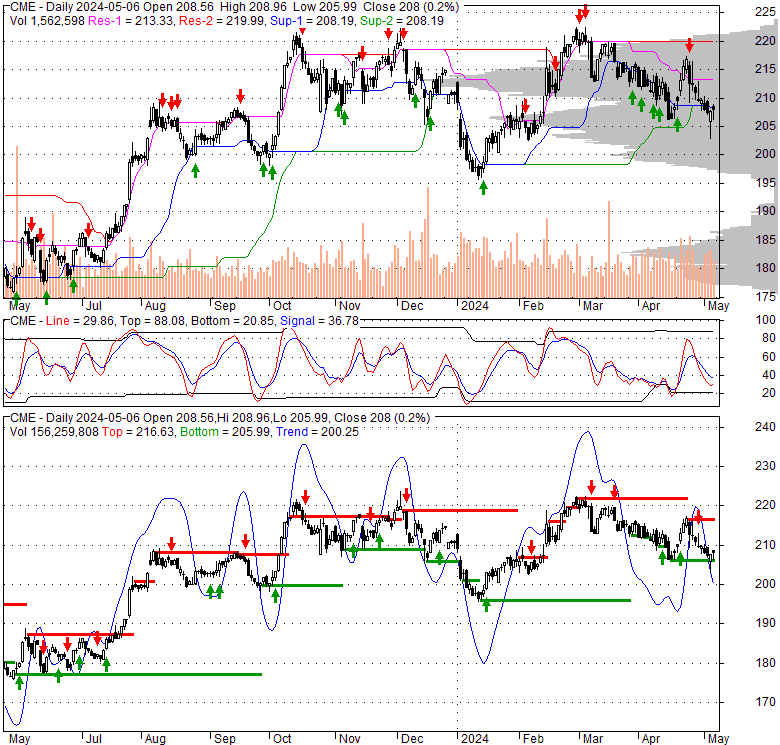
CME’s strengths can be seen in its strong growth, robust profitability and better efficiency compared with its peers. Technical indicators signal the bullish signs, as there is a bullish crossover in Stochastic oscillator. The MACD is trying to cross back up. The RSI stands at 46.35 with positive bias. We rate CME Group Inc. (CME) a STRONG BUY. |