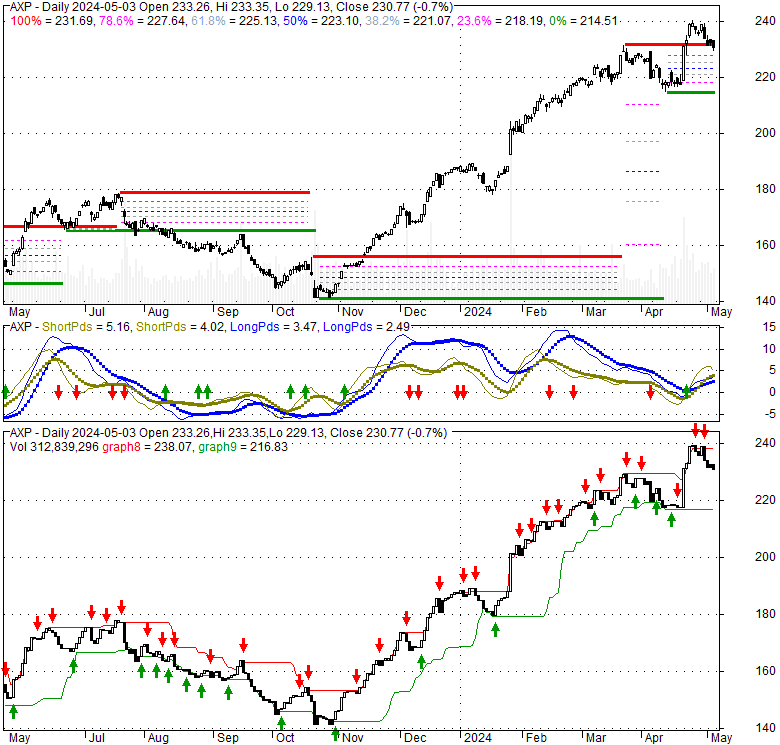
| 0 (0%) | 06-28 18:07 | |||||||||||||
|
|
| Short term | |
|||
| Mid term | ||||
| Targets | 6-month : | 280.96 | 1-year : | 328.16 |
| Resists | First : | 240.55 | Second : | 280.96 |
| Pivot price | 224.78 |
|||
| Supports | First : | 224.45 | Second : | 214.5 |
| MAs | MA(5) : | 235.89 |
MA(20) : | 224.94 |
| MA(100) : | 204.83 |
MA(250) : | 177.85 |
|
| MACD | MACD : | 3.9 |
Signal : | 2 |
| %K %D | K(14,3) : | 93.4 |
D(3) : | 93.9 |
| RSI | RSI(14): 69.7 |
|||
| 52-week | High : | 240.55 | Low : | 140.91 |
Price has closed above its short-term moving average. Short-term moving average is currently above mid-term; and above long-term moving average. From the relationship between price and moving averages: This stock is BULLISH in short-term; and BULLISH in mid-long term.[ AXP ] has closed below upper band by 12.0%. Bollinger Bands are 86% wider than normal. The large width of the bands suggest high volatility as compared to its normal range. The bands have been in this wide range for 2 days. This is a sign that the current trend might continue.
| If tomorrow: | Open lower | Open higher |
| High: | 240.57 - 241.41 | 241.41 - 242.18 |
| Low: | 235.57 - 236.67 | 236.67 - 237.67 |
| Close: | 237.4 - 238.91 | 238.91 - 240.3 |
Fri, 15 Jul 2016
Axion Power Initiates Collaborative Effort with Fengfan Co. Ltd., China to Test and Evaluate PbC® Technology and ... - PR Newswire
Wed, 08 Jun 2016
Axion Power International CEO Releases Letter to Shareholders Highlighting Positive Developments for Company ... - PR Newswire
Thu, 24 Apr 2014
Advanced lead-carbon (PbC) battery sports advantages for grid stability - Windpower Engineering
Tue, 23 Jul 2013
Axion Power's Potential For Explosive Growth - Forbes
Fri, 07 Dec 2012
EPower's Series Hybrid Electric Drive – Unmatched Fuel Economy For Heavy Trucks - Seeking Alpha
Sat, 06 Oct 2012
Anatomy Of A Supply And Demand Imbalance - Seeking Alpha
| Price to Book Value: P/BV, a ratio used to compare book value to its current market price, to gauge whether a stock is valued properly. |
Neutral |
| Price to Earnings: PE, the ratio for valuing a company that measures its current share price relative to its earnings per share (EPS). |
Neutral |
| Discounted cash flow: DCF, a valuation method used to estimate the value of an investment based on its expected future cash flows. |
Neutral |
| Return on Assets: ROA, indicates how profitable a company is in relation to its total assets, how efficiently uses assets to generate a profit. |
Neutral |
| Return on Equity: ROE, a measure of financial performance calculated by dividing net income by equity. a gauge of profitability and efficiency. |
Neutral |
| Debt to Equity: evaluate financial leverage, reflects the ability of equity to cover outstanding debts in the event of a business downturn. |
Neutral |
|
Exchange:
|
|
|
Sector:
|
|
|
Industry:
|
|
| Shares Out | 719 (M) |
| Shares Float | 566 (M) |
| Held by Insiders | 21 (%) |
| Held by Institutions | 65.2 (%) |
| Shares Short | 6,660 (K) |
| Shares Short P.Month | 8,320 (K) |
| EPS | 12.13 |
| EPS Est Next Qtrly | 0 |
| EPS Est This Year | 0 |
| EPS Est Next Year | 0 |
| Book Value (p.s.) | 40 |
| Profit Margin | 15.8 % |
| Operating Margin | 21.6 % |
| Return on Assets (ttm) | 3.5 % |
| Return on Equity (ttm) | 32.8 % |
| Qtrly Rev. Growth | 9.8 % |
| Gross Profit (p.s.) | 0 |
| Sales Per Share | 79.1 |
| EBITDA (p.s.) | 0 |
| Qtrly Earnings Growth | 38.7 % |
| Operating Cash Flow | 24,490 (M) |
| Levered Free Cash Flow | 0 (M) |
| PE Ratio | 19.56 |
| PEG Ratio | 1.3 |
| Price to Book value | 5.93 |
| Price to Sales | 3 |
| Price to Cash Flow | 6.97 |
| Dividend | 0 |
| Forward Dividend | 0 |
| Dividend Yield | 0% |
| Dividend Pay Date | Invalid DateTime. |
| Ex-Dividend Date | Invalid DateTime. |

|

|
|

|
|
|
|
|
|