| 0 (0%) | 06-28 18:07 | |||||||||||||
|
|
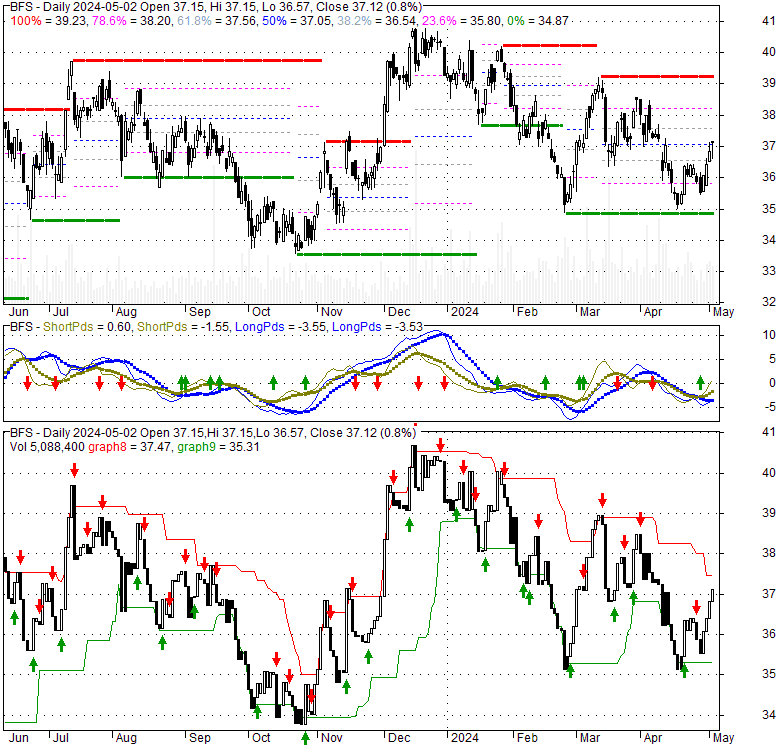
| Short term | ||||
| Mid term | ||||
| Targets | 6-month : | 43.44 |
1-year : | 45.04 |
| Resists | First : | 37.19 |
Second : | 38.56 |
| Pivot price | 36.71 |
|||
| Supports | First : | 34.97 | Second : | 29.1 |
| MAs | MA(5) : | 35.66 |
MA(20) : | 36.94 |
| MA(100) : | 38.08 |
MA(250) : | 36.91 |
|
| MACD | MACD : | -0.5 |
Signal : | -0.4 |
| %K %D | K(14,3) : | 18.8 |
D(3) : | 11.4 |
| RSI | RSI(14): 46.2 |
|||
| 52-week | High : | 41.04 | Low : | 32.13 |
Price has closed above its short-term moving average. Short-term moving average is currently below mid-term; and below long-term moving average. From the relationship between price and moving averages: This stock is NEUTRAL in short-term; and BEARISH in mid-long term.[ BFS ] has closed above bottom band by 40.4%. Bollinger Bands are 15.3% wider than normal. The current width of the bands does not suggest anything about the future direction or movement of prices.
| If tomorrow: | Open lower | Open higher |
| High: | 36.48 - 36.66 | 36.66 - 36.81 |
| Low: | 35.02 - 35.22 | 35.22 - 35.41 |
| Close: | 36.02 - 36.36 | 36.36 - 36.67 |
Wed, 27 Mar 2024
Bangladeshi teen shot by BSF along Lalmonirhat border succumbed to injury - The Business Standard
Mon, 01 Oct 2018
Hurts Donut advances franchise plans - Springfield Business Journal
Mon, 28 Aug 2017
Arvest Bank strikes its biggest deal - Springfield Business Journal
Tue, 22 Aug 2017
Update: Arvest to Buy Bear State Bank in $391M All-Cash Deal - Arkansas Business
Tue, 22 Aug 2017
Arvest To Acquire Bear State Financial In $391 Million Deal - KUAR
Wed, 18 Jan 2017
Bear State Financial, Inc. Announces Promotion of Matt Machen to Chief Executive Officer - Business Wire
| Price to Book Value: P/BV, a ratio used to compare book value to its current market price, to gauge whether a stock is valued properly. |
Outperform |
| Price to Earnings: PE, the ratio for valuing a company that measures its current share price relative to its earnings per share (EPS). |
Outperform |
| Discounted cash flow: DCF, a valuation method used to estimate the value of an investment based on its expected future cash flows. |
Neutral |
| Return on Assets: ROA, indicates how profitable a company is in relation to its total assets, how efficiently uses assets to generate a profit. |
Neutral |
| Return on Equity: ROE, a measure of financial performance calculated by dividing net income by equity. a gauge of profitability and efficiency. |
Neutral |
| Debt to Equity: evaluate financial leverage, reflects the ability of equity to cover outstanding debts in the event of a business downturn. |
Outperform |
|
Exchange:
NASDAQ
|
|
|
Sector:
|
|
|
Industry:
|
|
| Shares Out | 24 (M) |
| Shares Float | 13 (M) |
| Held by Insiders | 48.1 (%) |
| Held by Institutions | 46.6 (%) |
| Shares Short | 95 (K) |
| Shares Short P.Month | 124 (K) |
| EPS | 1.73 |
| EPS Est Next Qtrly | 0 |
| EPS Est This Year | 0 |
| EPS Est Next Year | 0 |
| Book Value (p.s.) | 6.78 |
| Profit Margin | 20.4 % |
| Operating Margin | 45.1 % |
| Return on Assets (ttm) | 3.8 % |
| Return on Equity (ttm) | 13.4 % |
| Qtrly Rev. Growth | 7 % |
| Gross Profit (p.s.) | 0 |
| Sales Per Share | 10.72 |
| EBITDA (p.s.) | 6.77 |
| Qtrly Earnings Growth | 14.5 % |
| Operating Cash Flow | 118 (M) |
| Levered Free Cash Flow | 107 (M) |
| PE Ratio | 21.01 |
| PEG Ratio | 3.5 |
| Price to Book value | 5.36 |
| Price to Sales | 3.38 |
| Price to Cash Flow | 7.4 |
| Dividend | 0 |
| Forward Dividend | 0 |
| Dividend Yield | 0% |
| Dividend Pay Date | Invalid DateTime. |
| Ex-Dividend Date | Invalid DateTime. |

|

|
|

|
|
|
|
|
|