| 18.58 0 (0%) | 12-22 16:00 | |||||||||||||
|
|
| Short term | |
|||
| Mid term | ||||
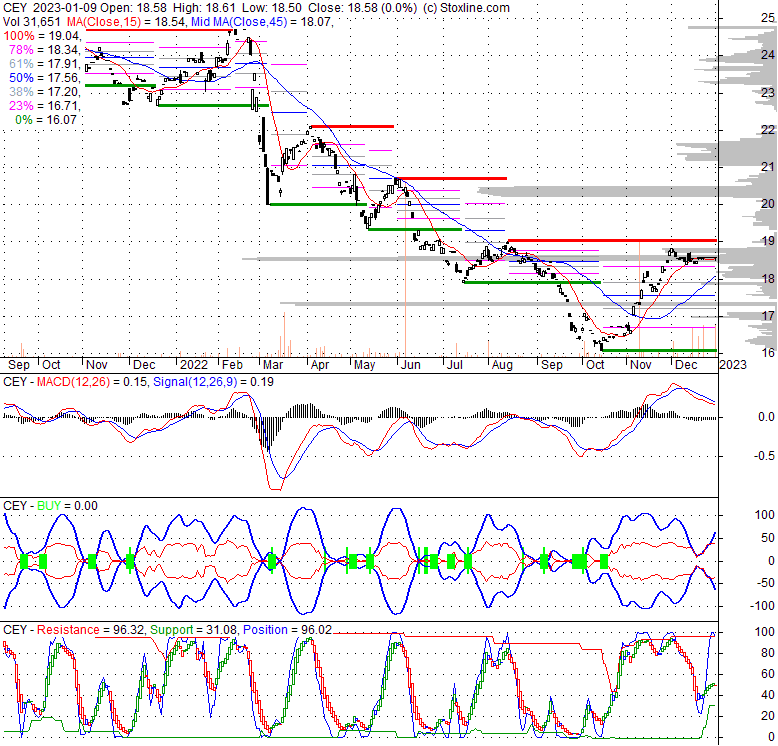
| Targets | 6-month : | 21.99 | 1-year : | 25.68 |
| Resists | First : | 18.82 | Second : | 21.99 |
| Pivot price | 18.54 |
|||
| Supports | First : | 18.45 |
Second : | 18.22 |
| MAs | MA(5) : | 18.57 | MA(20) : | 18.54 |
| MA(100) : | 17.76 |
MA(250) : | 19.64 |
|
| MACD | MACD : | 0.1 |
Signal : | 0.1 |
| %K %D | K(14,3) : | 52.8 | D(3) : | 52.8 |
| RSI | RSI(14): 63.7 | |||
| 52-week | High : | 24.92 | Low : | 16.06 |
Price has closed below its short-term moving average. Short-term moving average is currently above mid-term; and above long-term moving average. From the relationship between price and moving averages: This stock is NEUTRAL in short-term; and BULLISH in mid-long term.[ CEY ] has closed below upper band by 32.0%. Bollinger Bands are 81% narrower than normal. The narrow width of the bands suggests low volatility as compared to its normal range. The bands have been in this narrow range for 11 bars. This is a sign that the market may be about to initiate a new trend.
| If tomorrow: | Open lower | Open higher |
| High: | 18.65 - 18.75 | 18.75 - 18.82 |
| Low: | 18.24 - 18.37 | 18.37 - 18.47 |
| Close: | 18.4 - 18.59 | 18.59 - 18.75 |
The fund seeks to achieve its investment objective by investing, under normal market conditions, at least 80% of its assets directly or indirectly in the securities included in the Nasdaq Victory Emerging Market High Dividend 100 Volatility Weighted Index (the "index"). The index identifies the 100 highest dividend yielding stocks in the Nasdaq Victory Emerging Market 500 Volatility Weighted Index.
Thu, 14 Mar 2024
CDC: Revisiting This Once Top-Performing High-Dividend ETF (NASDAQ:CDC) - Seeking Alpha
Fri, 03 Dec 2021
High Dividend ETFs: 5 Best Performing For 2022 - Seeking Alpha
Tue, 05 Oct 2021
Top Performing Dividend ETFs For Q3 2021 - ETF Focus on TheStreet: ETF research and Trade Ideas - TheStreet
Wed, 03 May 2017
How Volatility Weighted ETFs Work | etf.com - etf.com
| Price to Book Value: P/BV, a ratio used to compare book value to its current market price, to gauge whether a stock is valued properly. |
Neutral |
| Price to Earnings: PE, the ratio for valuing a company that measures its current share price relative to its earnings per share (EPS). |
Neutral |
| Discounted cash flow: DCF, a valuation method used to estimate the value of an investment based on its expected future cash flows. |
Neutral |
| Return on Assets: ROA, indicates how profitable a company is in relation to its total assets, how efficiently uses assets to generate a profit. |
Neutral |
| Return on Equity: ROE, a measure of financial performance calculated by dividing net income by equity. a gauge of profitability and efficiency. |
Neutral |
| Debt to Equity: evaluate financial leverage, reflects the ability of equity to cover outstanding debts in the event of a business downturn. |
Neutral |
|
Exchange:
NASDAQ
|
|
|
Sector:
|
|
|
Industry:
|
|
| Shares Out | 0 (M) |
| Shares Float | 0 (M) |
| Held by Insiders | 0 (%) |
| Held by Institutions | 0 (%) |
| Shares Short | 0 (K) |
| Shares Short P.Month | 0 (K) |
| EPS | 0 |
| EPS Est Next Qtrly | 0 |
| EPS Est This Year | 0 |
| EPS Est Next Year | 0 |
| Book Value (p.s.) | 0 |
| Profit Margin | 0 % |
| Operating Margin | 0 % |
| Return on Assets (ttm) | 0 % |
| Return on Equity (ttm) | 0 % |
| Qtrly Rev. Growth | 0 % |
| Gross Profit (p.s.) | 0 |
| Sales Per Share | 0 |
| EBITDA (p.s.) | 0 |
| Qtrly Earnings Growth | 0 % |
| Operating Cash Flow | 0 (M) |
| Levered Free Cash Flow | 0 (M) |
| PE Ratio | 0 |
| PEG Ratio | 0 |
| Price to Book value | 0 |
| Price to Sales | 0 |
| Price to Cash Flow | 0 |
| Dividend | 0 |
| Forward Dividend | 0 |
| Dividend Yield | 0% |
| Dividend Pay Date | Invalid DateTime. |
| Ex-Dividend Date | Invalid DateTime. |

|

|
|

|
|
|
|
|
|