| 0 (0%) | 04-18 23:43 | |||||||||||||
|
|
| Short term | ||||
| Mid term | |
|||
| Targets | 6-month : | 20.21 | 1-year : | 21.59 |
| Resists | First : | 17.3 | Second : | 18.48 |
| Pivot price | 16.51 |
|||
| Supports | First : | 15.39 | Second : | 12.81 |
| MAs | MA(5) : | 15.98 |
MA(20) : | 16.69 |
| MA(100) : | 18.04 |
MA(250) : | 17.87 |
|
| MACD | MACD : | -0.4 |
Signal : | -0.3 |
| %K %D | K(14,3) : | 23.1 |
D(3) : | 17.3 |
| RSI | RSI(14): 35.2 | |||
| 52-week | High : | 22 | Low : | 15.39 |
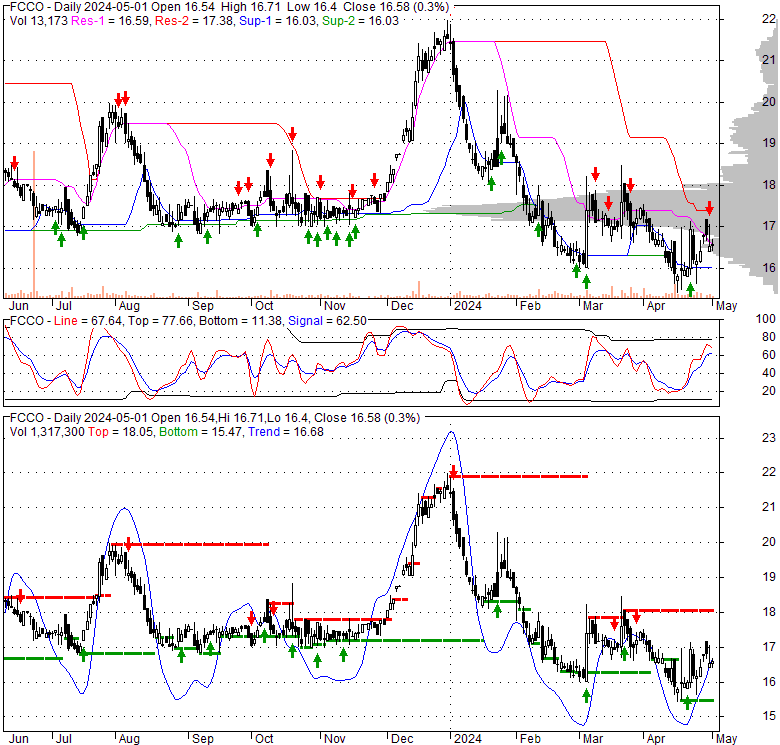
Price has closed below its short-term moving average. Short-term moving average is currently below mid-term; and below long-term moving average. From the relationship between price and moving averages: This stock is BEARISH in short-term; and BEARISH in mid-long term.[ FCCO ] has closed above bottom band by 21.9%. Bollinger Bands are 12.3% narrower than normal. The current width of the bands does not suggest anything about the future direction or movement of prices.
| If tomorrow: | Open lower | Open higher |
| High: | 16.18 - 16.26 | 16.26 - 16.34 |
| Low: | 15.6 - 15.7 | 15.7 - 15.79 |
| Close: | 15.77 - 15.92 | 15.92 - 16.08 |
Thu, 09 Nov 2023
WALLACEBURG ARTS: CFCO’s contributions to the airwaves - Wallaceburg Courier Press
Wed, 13 May 2020
Cheryl Johnstone, A Chatham-Kent Athlete Who Came baCK - Chatham-Kent Sports Network
Tue, 24 Mar 2020
Regulations & Guidance | Office for People With Developmental Disabilities - OPWDD
Mon, 01 Jul 2019
13 people, mainly stowaways, killed in Congo train crash - New Vision
Wed, 23 Feb 2011
Rail MOU extended pending finalization of heads of agreement with rail studies underway – Sierra Express Media - Sierra Express Media
Tue, 22 Jun 2010
Several dozen dead in rail disaster - FRANCE 24 English
| Price to Book Value: P/BV, a ratio used to compare book value to its current market price, to gauge whether a stock is valued properly. |
Neutral |
| Price to Earnings: PE, the ratio for valuing a company that measures its current share price relative to its earnings per share (EPS). |
Neutral |
| Discounted cash flow: DCF, a valuation method used to estimate the value of an investment based on its expected future cash flows. |
Neutral |
| Return on Assets: ROA, indicates how profitable a company is in relation to its total assets, how efficiently uses assets to generate a profit. |
Neutral |
| Return on Equity: ROE, a measure of financial performance calculated by dividing net income by equity. a gauge of profitability and efficiency. |
Neutral |
| Debt to Equity: evaluate financial leverage, reflects the ability of equity to cover outstanding debts in the event of a business downturn. |
Neutral |
|
Exchange:
|
|
|
Sector:
|
|
|
Industry:
|
|
| Shares Out | 8 (M) |
| Shares Float | 7 (M) |
| Held by Insiders | 4 (%) |
| Held by Institutions | 57.4 (%) |
| Shares Short | 161 (K) |
| Shares Short P.Month | 138 (K) |
| EPS | 1.54 |
| EPS Est Next Qtrly | 0 |
| EPS Est This Year | 0 |
| EPS Est Next Year | 0 |
| Book Value (p.s.) | 17.22 |
| Profit Margin | 20.3 % |
| Operating Margin | 30.3 % |
| Return on Assets (ttm) | 0.6 % |
| Return on Equity (ttm) | 9.5 % |
| Qtrly Rev. Growth | -6.5 % |
| Gross Profit (p.s.) | 0 |
| Sales Per Share | 7.6 |
| EBITDA (p.s.) | 0 |
| Qtrly Earnings Growth | -19.2 % |
| Operating Cash Flow | 12 (M) |
| Levered Free Cash Flow | 0 (M) |
| PE Ratio | 10.29 |
| PEG Ratio | 0 |
| Price to Book value | 0.92 |
| Price to Sales | 2.09 |
| Price to Cash Flow | 9.95 |
| Dividend | 0 |
| Forward Dividend | 0 |
| Dividend Yield | 0% |
| Dividend Pay Date | Invalid DateTime. |
| Ex-Dividend Date | Invalid DateTime. |

|

|
|

|
|
|
|
|
|