| 0 (0%) | 04-18 00:47 | |||||||||||||
|
|
| Short term | ||||
| Mid term | |
|||
| Targets | 6-month : | 28.05 | 1-year : | 29.15 |
| Resists | First : | 24.02 | Second : | 24.95 |
| Pivot price | 23.58 |
|||
| Supports | First : | 22.5 | Second : | 18.72 |
| MAs | MA(5) : | 23.02 |
MA(20) : | 23.75 |
| MA(100) : | 0 | MA(250) : | 0 | |
| MACD | MACD : | -0.4 |
Signal : | -0.3 |
| %K %D | K(14,3) : | 16.2 |
D(3) : | 9.2 |
| RSI | RSI(14): 37.6 |
|||
| 52-week | High : | 27.09 | Low : | 22.5 |
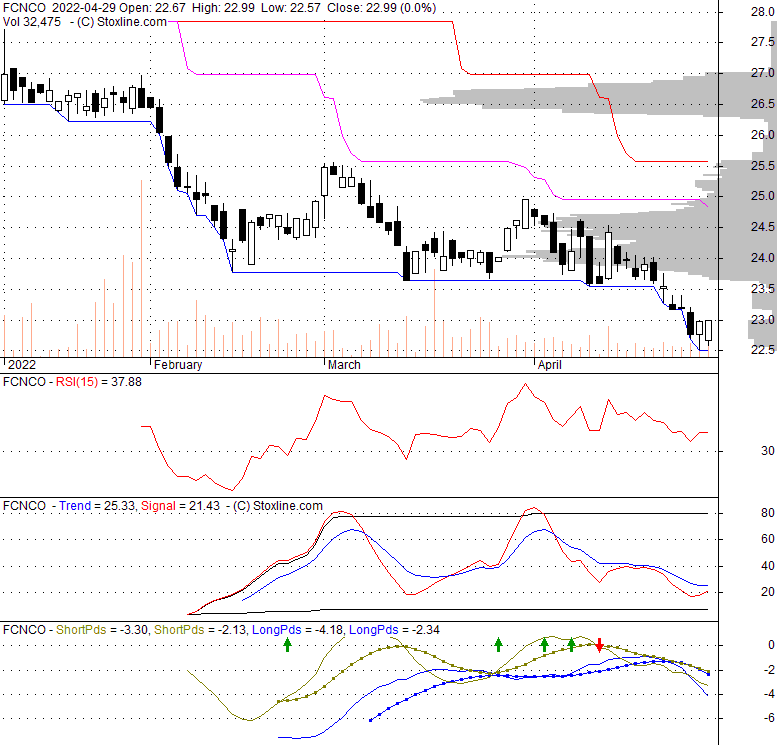
Price has closed below its short-term moving average. Short-term moving average is currently below mid-term; and below long-term moving average. From the relationship between price and moving averages: This stock is BEARISH in short-term; and NEUTRAL in mid-long term.[ FCNCO ] has closed above bottom band by 18.7%. Bollinger Bands are 0% narrower than normal.
| If tomorrow: | Open lower | Open higher |
| High: | 23.02 - 23.11 | 23.11 - 23.2 |
| Low: | 22.34 - 22.44 | 22.44 - 22.54 |
| Close: | 22.82 - 22.99 | 22.99 - 23.14 |
Tue, 13 Feb 2024
CNCO Is Breaking Up After Nearly 7 Years: 'We're Ready to Try New Things' - AOL
Thu, 30 Nov 2023
After CNCO, Joel Deleōn Is Ready to Be Heard - Rolling Stone
Tue, 29 Aug 2023
CNCO Will Livestream One of Their Final Concerts for Fans in Latin America - Remezcla
Thu, 24 Aug 2023
Zabdiel de Jesus on Launching Solo Career After CNCO: ‘I’m Nervous But Excited’ - Billboard
Fri, 28 Jul 2023
Things to do this weekend in Miami - Axios
Fri, 21 Jul 2023
CNCO Perform Final Song 'La Última Canción' at Premios Juventud 2023 – Watch - Just Jared Jr.
| Price to Book Value: P/BV, a ratio used to compare book value to its current market price, to gauge whether a stock is valued properly. |
Neutral |
| Price to Earnings: PE, the ratio for valuing a company that measures its current share price relative to its earnings per share (EPS). |
Neutral |
| Discounted cash flow: DCF, a valuation method used to estimate the value of an investment based on its expected future cash flows. |
Neutral |
| Return on Assets: ROA, indicates how profitable a company is in relation to its total assets, how efficiently uses assets to generate a profit. |
Neutral |
| Return on Equity: ROE, a measure of financial performance calculated by dividing net income by equity. a gauge of profitability and efficiency. |
Neutral |
| Debt to Equity: evaluate financial leverage, reflects the ability of equity to cover outstanding debts in the event of a business downturn. |
Neutral |
|
Exchange:
|
|
|
Sector:
|
|
|
Industry:
|
|
| Shares Out | 0 (M) |
| Shares Float | 8 (M) |
| Held by Insiders | 0 (%) |
| Held by Institutions | 19.3 (%) |
| Shares Short | 5 (K) |
| Shares Short P.Month | 0 (K) |
| EPS | 0 |
| EPS Est Next Qtrly | 0 |
| EPS Est This Year | 0 |
| EPS Est Next Year | 0 |
| Book Value (p.s.) | 0 |
| Profit Margin | 28.2 % |
| Operating Margin | 38.7 % |
| Return on Assets (ttm) | 1 % |
| Return on Equity (ttm) | 12.2 % |
| Qtrly Rev. Growth | -0.7 % |
| Gross Profit (p.s.) | 0 |
| Sales Per Share | 0 |
| EBITDA (p.s.) | 0 |
| Qtrly Earnings Growth | -11.2 % |
| Operating Cash Flow | 0 (M) |
| Levered Free Cash Flow | 0 (M) |
| PE Ratio | 0 |
| PEG Ratio | 0 |
| Price to Book value | 0 |
| Price to Sales | 0 |
| Price to Cash Flow | 0 |
| Dividend | 0 |
| Forward Dividend | 0 |
| Dividend Yield | 0% |
| Dividend Pay Date | 2021-12-14 |
| Ex-Dividend Date | Invalid DateTime. |

|

|
|

|
|
|
|
|
|