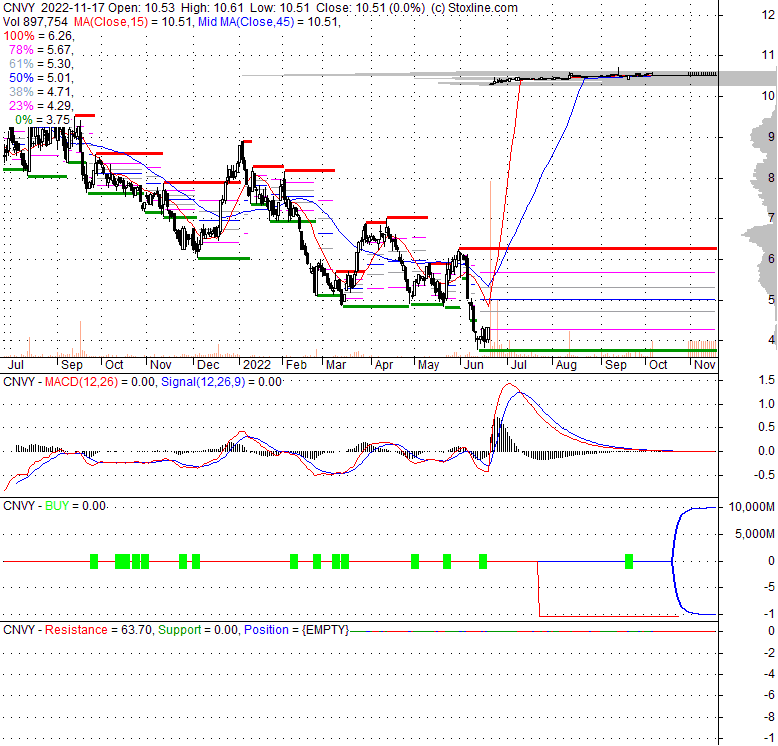
| 10.51 -0.05 (-0.47%) | 10-06 16:00 | |||||||||||||
|
|
| Short term | |
|||
| Mid term | |
|||
| Targets | 6-month : | 12.34 | 1-year : | 12.39 |
| Resists | First : | 10.57 | Second : | 10.6 |
| Pivot price | 10.51 | |||
| Supports | First : | 10.51 | Second : | 8.74 |
| MAs | MA(5) : | 10.51 | MA(20) : | 10.51 |
| MA(100) : | 10.49 |
MA(250) : | 8.07 |
|
| MACD | MACD : | 0 |
Signal : | 0 |
| %K %D | K(14,3) : | 0 | D(3) : | 0 |
| RSI | RSI(14): 51.5 | |||
| 52-week | High : | 10.72 | Low : | 3.75 |
Price has closed below its short-term moving average. Short-term moving average is currently below mid-term; and above long-term moving average. From the relationship between price and moving averages: This stock is NEUTRAL in short-term; and NEUTRAL in mid-long term.[ CNVY ] has closed Bollinger Bands are 100% narrower than normal. The narrow width of the bands suggests low volatility as compared to its normal range. The bands have been in this narrow range for 92 bars. This is a sign that the market may be about to initiate a new trend.
| If tomorrow: | Open lower | Open higher |
| High: | 10.62 - 10.67 | 10.67 - 10.72 |
| Low: | 10.39 - 10.45 | 10.45 - 10.5 |
| Close: | 10.42 - 10.51 | 10.51 - 10.59 |
Convey Health Solutions Holdings, Inc. provides technology enabled solutions and advisory services to assist its clients with workflows across product developments, sales, member experience, clinical management, core operations, and business intelligence and analytics. It operates through two segments, Technology Enabled Solutions and Advisory Services. The Technology Enabled Solutions segment offers technology solutions through web-based customizable application that is used to identify, track, and administer contractual services, or benefits provided under a client's plan to its Medicare and Medicaid beneficiaries. It also provides analytics over healthcare data to capture and assess gaps in risk documentation, quality, clinical care, and compliance. The company also offers health plan management, data analytics, supplemental benefit, advisory, and software services. The Advisory Services segment offers sales and marketing strategies, provider network strategies, compliance, star ratings, quality, clinical, pharmacy, analytics, and risk adjustment. It serves government sponsored, medicare advantage, medicare, as well as pharmacy benefits managers. The company was founded in 2001 and is headquartered in Fort Lauderdale, Florida. Convey Health Solutions Holdings, Inc. is a former subsidiary of TPG Cannes Aggregation, L.P.
Fri, 07 Oct 2022
Convey Announces Closing of Acquisition by TPG - PR Newswire
Mon, 15 Aug 2022
INVESTIGATION ALERT: Scott+Scott Attorneys at Law LLP Investigates Convey Health Solutions Holdings, Inc.'s ... - Business Wire
Wed, 13 Jul 2022
Convey Health Stock: An Almost Certain Deal Close (NYSE:CNVY) - Seeking Alpha
Thu, 30 Jun 2022
Public company will close Broward operation, lay off 88 workers ahead of being acquired - South Florida Business ... - The Business Journals
Wed, 22 Jun 2022
Why TPG Is Buying Convey (CNVY) For About $1.1 Billion - Pulse 2.0
Wed, 22 Jun 2022
TPG to acquire remaining stake in Convey Health, shares surge - Reuters.com
| Price to Book Value: P/BV, a ratio used to compare book value to its current market price, to gauge whether a stock is valued properly. |
Outperform |
| Price to Earnings: PE, the ratio for valuing a company that measures its current share price relative to its earnings per share (EPS). |
Underperform |
| Discounted cash flow: DCF, a valuation method used to estimate the value of an investment based on its expected future cash flows. |
Outperform |
| Return on Assets: ROA, indicates how profitable a company is in relation to its total assets, how efficiently uses assets to generate a profit. |
Neutral |
| Return on Equity: ROE, a measure of financial performance calculated by dividing net income by equity. a gauge of profitability and efficiency. |
Neutral |
| Debt to Equity: evaluate financial leverage, reflects the ability of equity to cover outstanding debts in the event of a business downturn. |
Outperform |
|
Exchange:
NYSE
|
|
|
Sector:
Healthcare
|
|
|
Industry:
Medical - Healthcare Information Services
|
|
| Shares Out | 73 (M) |
| Shares Float | 15 (M) |
| Held by Insiders | 3.4 (%) |
| Held by Institutions | 87 (%) |
| Shares Short | 290 (K) |
| Shares Short P.Month | 524 (K) |
| EPS | -0.16 |
| EPS Est Next Qtrly | 0 |
| EPS Est This Year | 0 |
| EPS Est Next Year | 0 |
| Book Value (p.s.) | 7.25 |
| Profit Margin | -1.9 % |
| Operating Margin | 7 % |
| Return on Assets (ttm) | 1.8 % |
| Return on Equity (ttm) | -1.4 % |
| Qtrly Rev. Growth | 19.2 % |
| Gross Profit (p.s.) | 1.94 |
| Sales Per Share | 5 |
| EBITDA (p.s.) | 0.76 |
| Qtrly Earnings Growth | 0 % |
| Operating Cash Flow | 5 (M) |
| Levered Free Cash Flow | 5 (M) |
| PE Ratio | -70.07 |
| PEG Ratio | 0 |
| Price to Book value | 1.44 |
| Price to Sales | 2.1 |
| Price to Cash Flow | 154.21 |
| Dividend | 0 |
| Forward Dividend | 0 |
| Dividend Yield | 0% |
| Dividend Pay Date | Invalid DateTime. |
| Ex-Dividend Date | Invalid DateTime. |

|

|
|

|
|
|
|
|
|