| 10.55 0.33 (3.23%) | 12-20 16:00 | |||||||||||||
|
|
| Short term | ||||
| Mid term | ||||
| Targets | 6-month : | 13.22 | 1-year : | 15.44 |
| Resists | First : | 11.31 | Second : | 13.22 |
| Pivot price | 10.33 |
|||
| Supports | First : | 10.13 | Second : | 9.39 |
| MAs | MA(5) : | 10.55 | MA(20) : | 10.26 |
| MA(100) : | 10.01 |
MA(250) : | 9.88 |
|
| MACD | MACD : | 0.1 |
Signal : | 0.1 |
| %K %D | K(14,3) : | 59.8 | D(3) : | 59.8 |
| RSI | RSI(14): 63 | |||
| 52-week | High : | 11.31 | Low : | 9.39 |
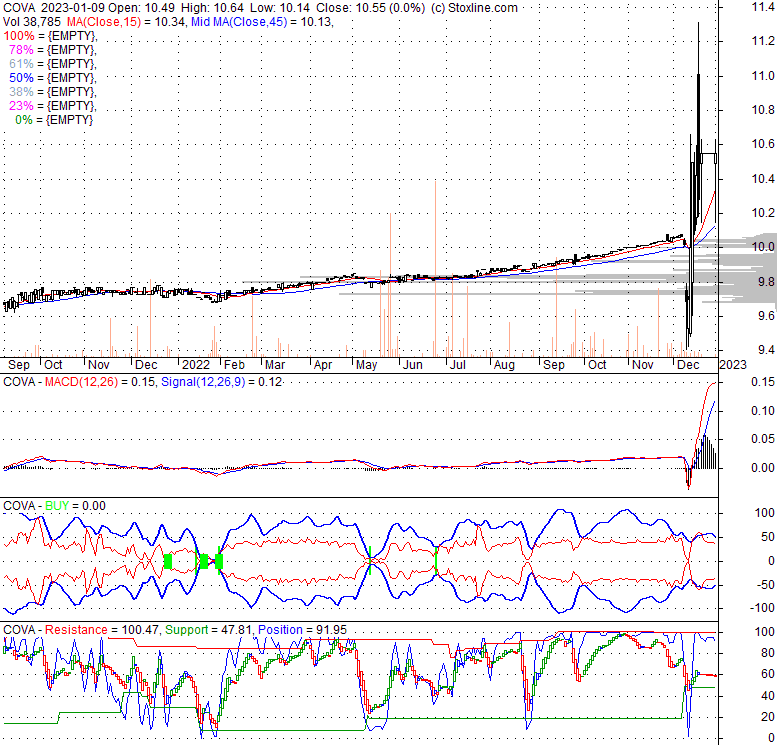
Price has closed below its short-term moving average. Short-term moving average is currently above mid-term; and above long-term moving average. From the relationship between price and moving averages: This stock is NEUTRAL in short-term; and BULLISH in mid-long term.[ COVA ] has closed below upper band by 32.7%. Bollinger Bands are 582.3% wider than normal. The large width of the bands suggest high volatility as compared to its normal range. The bands have been in this wide range for 14 days. This is a sign that the current trend might continue.
| If tomorrow: | Open lower | Open higher |
| High: | 10.66 - 10.72 | 10.72 - 10.76 |
| Low: | 10 - 10.07 | 10.07 - 10.12 |
| Close: | 10.45 - 10.56 | 10.56 - 10.65 |
COVA Acquisition Corp. does not have significant operations. It focuses on effecting a merger, share exchange, asset acquisition, share purchase, reorganization, or similar business combination with one or more businesses or entities. It intends to focus on businesses in the technology industry in Southeast Asia or the United States. The company was incorporated in 2020 and is based in San Francisco, California.
Tue, 20 Feb 2024
Geely's Luxury EV Brand Lotus Tech Receives Approval for Nasdaq Listing - Pandaily
Thu, 22 Dec 2022
Mobility technology player ECARX floats shares on Nasdaq - Xinhua
Thu, 22 Dec 2022
Mobility tech firm ECARX makes Nasdaq debut - World - Chinadaily.com.cn - China Daily
Mon, 30 May 2022
Breakingviews - Geely-backed auto SPAC deal revs up too fast - Reuters.com
Thu, 26 May 2022
Car tech firm ECARX to go public in $3.8 bln blank-check deal - Reuters.com
Thu, 26 May 2022
Geely-backed tech firm ECARX to go public in $3.8B blank-check deal - Automotive News Europe
| Price to Book Value: P/BV, a ratio used to compare book value to its current market price, to gauge whether a stock is valued properly. |
Underperform |
| Price to Earnings: PE, the ratio for valuing a company that measures its current share price relative to its earnings per share (EPS). |
Outperform |
| Discounted cash flow: DCF, a valuation method used to estimate the value of an investment based on its expected future cash flows. |
Outperform |
| Return on Assets: ROA, indicates how profitable a company is in relation to its total assets, how efficiently uses assets to generate a profit. |
Neutral |
| Return on Equity: ROE, a measure of financial performance calculated by dividing net income by equity. a gauge of profitability and efficiency. |
Underperform |
| Debt to Equity: evaluate financial leverage, reflects the ability of equity to cover outstanding debts in the event of a business downturn. |
Underperform |
|
Exchange:
NASDAQ
|
|
|
Sector:
Financial Services
|
|
|
Industry:
Shell Companies
|
|
| Shares Out | 30 (M) |
| Shares Float | 30 (M) |
| Held by Insiders | 0 (%) |
| Held by Institutions | 92.2 (%) |
| Shares Short | 8 (K) |
| Shares Short P.Month | 5 (K) |
| EPS | 0.01 |
| EPS Est Next Qtrly | 0 |
| EPS Est This Year | 0 |
| EPS Est Next Year | 0 |
| Book Value (p.s.) | -0.41 |
| Profit Margin | 0 % |
| Operating Margin | 0 % |
| Return on Assets (ttm) | 0 % |
| Return on Equity (ttm) | 0 % |
| Qtrly Rev. Growth | 0 % |
| Gross Profit (p.s.) | 0 |
| Sales Per Share | 0 |
| EBITDA (p.s.) | 0 |
| Qtrly Earnings Growth | -68.5 % |
| Operating Cash Flow | -1 (M) |
| Levered Free Cash Flow | 0 (M) |
| PE Ratio | 527.5 |
| PEG Ratio | 0 |
| Price to Book value | -25.74 |
| Price to Sales | 0 |
| Price to Cash Flow | -251.2 |
| Dividend | 0 |
| Forward Dividend | 0 |
| Dividend Yield | 0% |
| Dividend Pay Date | Invalid DateTime. |
| Ex-Dividend Date | Invalid DateTime. |

|

|
|

|
|
|
|
|
|