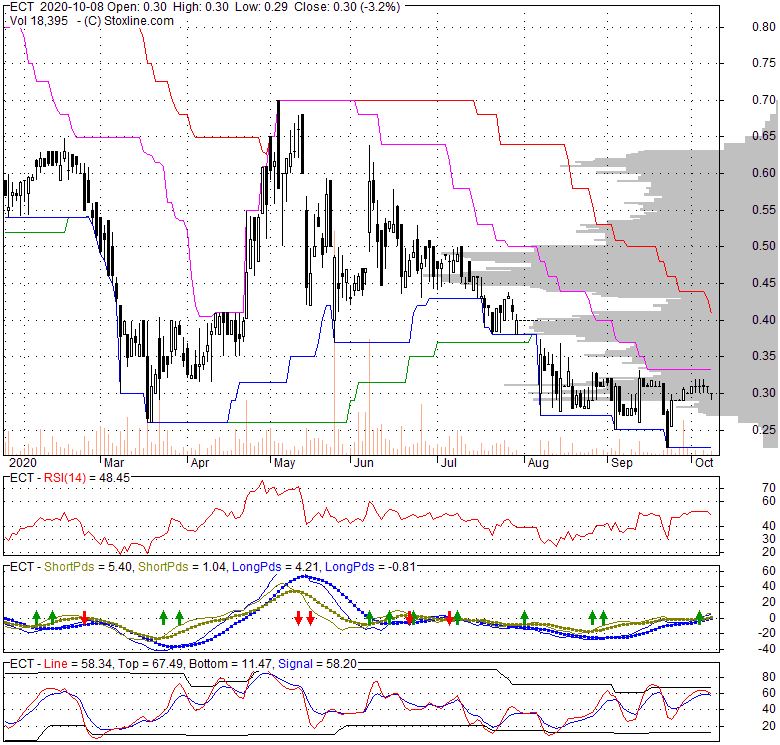
| 0.0002 0 (0%) | 12-31 19:00 | |||||||||||||
|
|
| Short term | |
|||
| Mid term | ||||
| Targets | 6-month : | 26.22 | 1-year : | 30.62 |
| Resists | First : | 22.45 | Second : | 26.22 |
| Pivot price | 21.57 |
|||
| Supports | First : | 19.61 | Second : | 17.87 |
| MAs | MA(5) : | 21.14 |
MA(20) : | 21.32 |
| MA(100) : | 17.81 |
MA(250) : | 15.36 |
|
| MACD | MACD : | 0.3 |
Signal : | 0.4 |
| %K %D | K(14,3) : | 30 |
D(3) : | 38.1 |
| RSI | RSI(14): 54.7 | |||
| 52-week | High : | 22.45 | Low : | 11.31 |
Price has closed above its short-term moving average. Short-term moving average is currently above mid-term; and above long-term moving average. From the relationship between price and moving averages: This stock is BULLISH in short-term; and BULLISH in mid-long term.[ ESTE ] has closed above bottom band by 24.1%. Bollinger Bands are 44.7% narrower than normal. The narrow width of the bands suggests low volatility as compared to its normal range. The bands have been in this narrow range for 1 bars. This is a sign that the market may be about to initiate a new trend.
| If tomorrow: | Open lower | Open higher |
| High: | 21.22 - 21.32 | 21.32 - 21.41 |
| Low: | 20.87 - 21.02 | 21.02 - 21.14 |
| Close: | 20.97 - 21.19 | 21.19 - 21.36 |
Echo Therapeutics, Inc. engages in the development of transdermal skin permeation and diagnostic medical devices for wearable-health consumer and diabetes outpatient markets. It is developing continuous glucose monitoring (CGM) system, a needle-free wireless continuous glucose monitoring system in a hospital setting in the European Union. The company has a licensing agreement with Ferndale Pharma Group, Inc. to develop, manufacture, distribute, and market devices for skin preparation prior to the application of topical anesthetics or analgesics prior to a range of needle-based medical procedures in North America, the United Kingdom, South America, Australia, New Zealand, Switzerland, and other portions of the European Community. In addition, it has a license agreement with Handok Pharmaceuticals Co., Ltd. to develop, use, market, import, and sell CGM to medical facilities and individual consumers in South Korea; and a license, development, and commercialization agreement with Medical Technologies Innovation Asia, Ltd to research, develop, manufacture, and use CGM in the People's Republic of China, Hong Kong, Macau, and Taiwan. The company was founded in 1989 and is headquartered in Iselin, New Jersey.
Wed, 14 Jan 2015
Amniox Medical taps ex-Smith & Nephew honcho Dugan for CEO | Personnel Moves - Mass Device
Tue, 30 Dec 2014
Alan W. Schoenbart named CFO of Echo Therapeutics - Philadelphia Business Journal - The Business Journals
Sat, 15 Jun 2013
The Best- And Worst-Performing Biotech Stocks June 7 To June 14 - Forbes
| Price to Book Value: P/BV, a ratio used to compare book value to its current market price, to gauge whether a stock is valued properly. |
Neutral |
| Price to Earnings: PE, the ratio for valuing a company that measures its current share price relative to its earnings per share (EPS). |
Neutral |
| Discounted cash flow: DCF, a valuation method used to estimate the value of an investment based on its expected future cash flows. |
Neutral |
| Return on Assets: ROA, indicates how profitable a company is in relation to its total assets, how efficiently uses assets to generate a profit. |
Neutral |
| Return on Equity: ROE, a measure of financial performance calculated by dividing net income by equity. a gauge of profitability and efficiency. |
Neutral |
| Debt to Equity: evaluate financial leverage, reflects the ability of equity to cover outstanding debts in the event of a business downturn. |
Neutral |

|
Exchange:
OTC
|
|
|
Sector:
Healthcare
|
|
|
Industry:
Medical - Devices
|
|
| Shares Out | 106 (M) |
| Shares Float | 37 (M) |
| Held by Insiders | 3.5 (%) |
| Held by Institutions | 91 (%) |
| Shares Short | 4,090 (K) |
| Shares Short P.Month | 3,290 (K) |
| EPS | 4.55 |
| EPS Est Next Qtrly | 0 |
| EPS Est This Year | 0 |
| EPS Est Next Year | 0 |
| Book Value (p.s.) | 10.44 |
| Profit Margin | 8.4 % |
| Operating Margin | 53 % |
| Return on Assets (ttm) | 0 % |
| Return on Equity (ttm) | 0 % |
| Qtrly Rev. Growth | 292.7 % |
| Gross Profit (p.s.) | 12.6 |
| Sales Per Share | 3.94 |
| EBITDA (p.s.) | 1.73 |
| Qtrly Earnings Growth | 0 % |
| Operating Cash Flow | 231 (M) |
| Levered Free Cash Flow | -206 (M) |
| PE Ratio | 4.64 |
| PEG Ratio | 0.2 |
| Price to Book value | 2.02 |
| Price to Sales | 5.36 |
| Price to Cash Flow | 9.75 |
| Dividend | 0 |
| Forward Dividend | 0 |
| Dividend Yield | 0% |
| Dividend Pay Date | Invalid DateTime. |
| Ex-Dividend Date | Invalid DateTime. |