| 13.595 0.016 (0.12%) | 10-19 12:35 | |||||||||||||
|
|
| Short term | |
|||
| Mid term | |
|||
| Targets | 6-month : | 15.94 | 1-year : | 18.62 |
| Resists | First : | 13.64 | Second : | 15.94 |
| Pivot price | 13.59 | |||
| Supports | First : | 13.43 | Second : | 13.3 |
| MAs | MA(5) : | 13.59 | MA(20) : | 13.59 |
| MA(100) : | 14.32 |
MA(250) : | 17.55 |
|
| MACD | MACD : | -0.1 |
Signal : | -0.1 |
| %K %D | K(14,3) : | 0 | D(3) : | 1 |
| RSI | RSI(14): 47.4 | |||
| 52-week | High : | 27 | Low : | 12.68 |
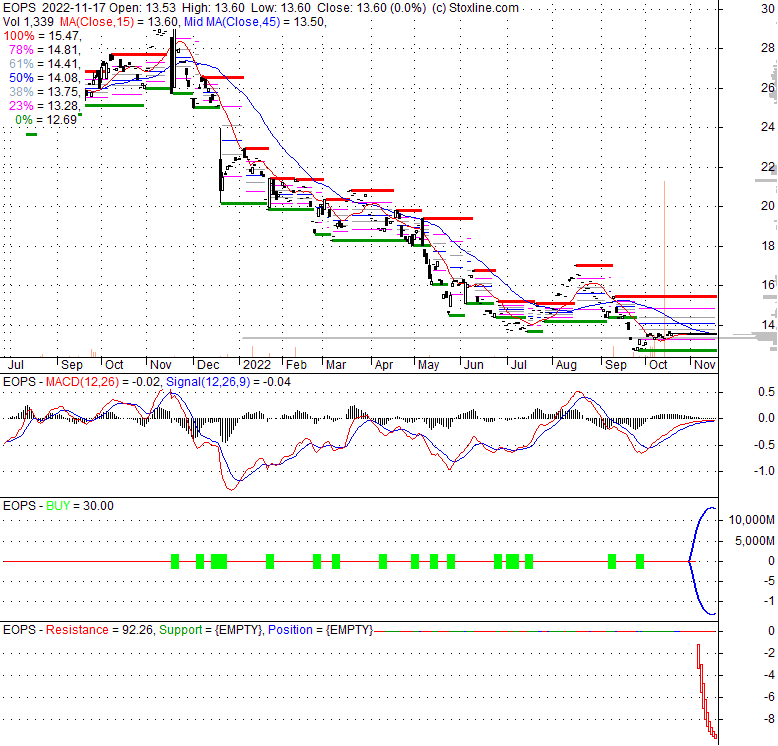
Price has closed below its short-term moving average. Short-term moving average is currently above mid-term; and below long-term moving average. From the relationship between price and moving averages: This stock is NEUTRAL in short-term; and NEUTRAL in mid-long term.[ EOPS ] has closed Bollinger Bands are 100% narrower than normal. The narrow width of the bands suggests low volatility as compared to its normal range. The bands have been in this narrow range for 27 bars. This is a sign that the market may be about to initiate a new trend.
| If tomorrow: | Open lower | Open higher |
| High: | 13.63 - 13.69 | 13.69 - 13.75 |
| Low: | 13.4 - 13.5 | 13.5 - 13.57 |
| Close: | 13.47 - 13.61 | 13.61 - 13.72 |
The Adviser seeks to achieve the total return portion of the fund’s investment objective by using a dynamic macro (top-down) and micro (bottom-up) approach to invest in a broad range of asset classes and individual investments, allowing the fund to pursue any and all investment opportunities. The fund may take long or short positions in the asset classes identified above either directly or indirectly through investments in ETFs, exchange-traded notes and derivative instruments. The fund may also invest in leveraged ETFs. The fund is non-diversified.
Mon, 17 Oct 2022
Semiconductor & Travel ETFs are this week's Top ETFs - Trackinsight
Sat, 19 Jun 2021
Passive investing world turned upside down as active funds boom - The Economic Times
Thu, 10 Jun 2021
Emles Launches Active Long/Short ETF - Business Wire
| Price to Book Value: P/BV, a ratio used to compare book value to its current market price, to gauge whether a stock is valued properly. |
Neutral |
| Price to Earnings: PE, the ratio for valuing a company that measures its current share price relative to its earnings per share (EPS). |
Neutral |
| Discounted cash flow: DCF, a valuation method used to estimate the value of an investment based on its expected future cash flows. |
Neutral |
| Return on Assets: ROA, indicates how profitable a company is in relation to its total assets, how efficiently uses assets to generate a profit. |
Neutral |
| Return on Equity: ROE, a measure of financial performance calculated by dividing net income by equity. a gauge of profitability and efficiency. |
Neutral |
| Debt to Equity: evaluate financial leverage, reflects the ability of equity to cover outstanding debts in the event of a business downturn. |
Neutral |
|
Exchange:
ETF
|
|
|
Sector:
|
|
|
Industry:
|
|
| Shares Out | 0 (M) |
| Shares Float | 0 (M) |
| Held by Insiders | 0 (%) |
| Held by Institutions | 0 (%) |
| Shares Short | 0 (K) |
| Shares Short P.Month | 0 (K) |
| EPS | 0 |
| EPS Est Next Qtrly | 0 |
| EPS Est This Year | 0 |
| EPS Est Next Year | 0 |
| Book Value (p.s.) | 0 |
| Profit Margin | 0 % |
| Operating Margin | 0 % |
| Return on Assets (ttm) | 0 % |
| Return on Equity (ttm) | 0 % |
| Qtrly Rev. Growth | 0 % |
| Gross Profit (p.s.) | 0 |
| Sales Per Share | 0 |
| EBITDA (p.s.) | 0 |
| Qtrly Earnings Growth | 0 % |
| Operating Cash Flow | 0 (M) |
| Levered Free Cash Flow | 0 (M) |
| PE Ratio | 0 |
| PEG Ratio | 0 |
| Price to Book value | 0 |
| Price to Sales | 0 |
| Price to Cash Flow | 0 |
| Dividend | 0 |
| Forward Dividend | 0 |
| Dividend Yield | 0% |
| Dividend Pay Date | Invalid DateTime. |
| Ex-Dividend Date | Invalid DateTime. |

|

|
|

|
|
|
|
|
|