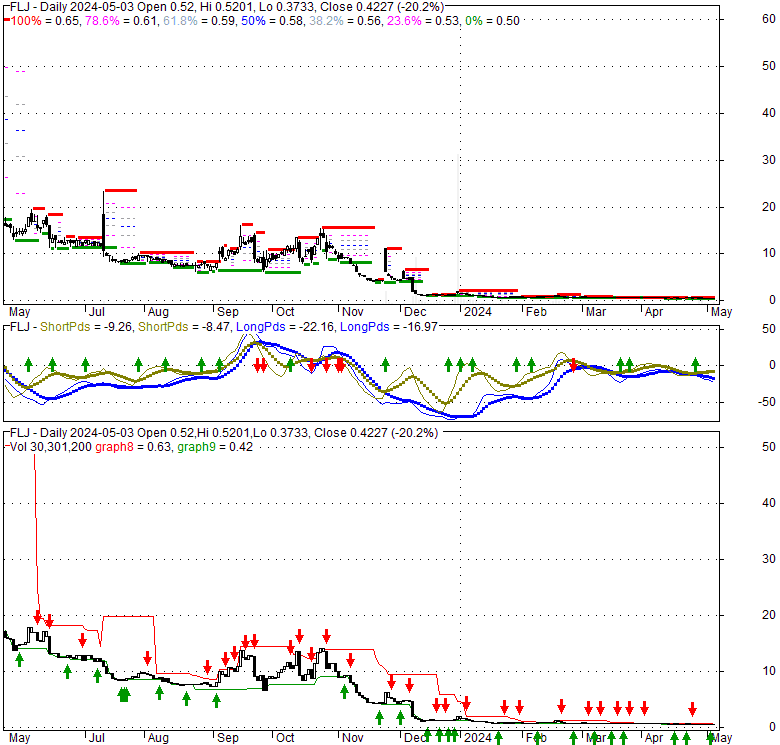
| 0.585 -0.013 (-2.17%) | 04-22 16:00 | |||||||||||||
|
|
| Short term | ||||
| Mid term | |
|||
| Targets | 6-month : | 0.78 | 1-year : | 0.9 |
| Resists | First : | 0.66 | Second : | 0.77 |
| Pivot price | 0.61 |
|||
| Supports | First : | 0.5 | Second : | 0.41 |
| MAs | MA(5) : | 0.56 |
MA(20) : | 0.63 |
| MA(100) : | 1.13 |
MA(250) : | 8.06 |
|
| MACD | MACD : | -0.1 |
Signal : | -0.1 |
| %K %D | K(14,3) : | 20.5 |
D(3) : | 17.4 |
| RSI | RSI(14): 42 |
|||
| 52-week | High : | 60 | Low : | 0.5 |
Price has closed above its short-term moving average. Short-term moving average is currently below mid-term; and below long-term moving average. From the relationship between price and moving averages: This stock is NEUTRAL in short-term; and BEARISH in mid-long term.[ FLJ ] has closed above bottom band by 37.9%. Bollinger Bands are 83.5% narrower than normal. The narrow width of the bands suggests low volatility as compared to its normal range. The bands have been in this narrow range for 78 bars. This is a sign that the market may be about to initiate a new trend.
| If tomorrow: | Open lower | Open higher |
| High: | 0.62 - 0.62 | 0.62 - 0.63 |
| Low: | 0.54 - 0.55 | 0.55 - 0.55 |
| Close: | 0.58 - 0.58 | 0.58 - 0.59 |
FLJ Group Limited operates a long-term apartment rental platform in the People's Republic of China. The company leases apartments from landlords, transforms them into standardized furnished rooms, and leases to people. It also provides internet connection and utility services as part of the lease agreement. The company was formerly known as Q&K International Group Limited and changed its name to FLJ Group Limited in September 2022. FLJ Group Limited was founded in 2012 and is based in Shanghai, the People's Republic of China.
Fri, 12 Apr 2024
FLJ Group Gears Up for AGM and Potential Rebranding - TipRanks.com - TipRanks
Tue, 09 Apr 2024
FLJ Group receives Nasdaq minimum bid price warning - Investing.com Nigeria
Tue, 20 Feb 2024
Why Fluor Shares Are Trading Lower By Around 8%? Here Are Other Stocks Moving In Tuesday's Mid-Day Session - Markets Insider
Fri, 29 Dec 2023
Top Penny Stocks For 2024? 4 For Your Watch List - Penny Stocks
Fri, 29 Dec 2023
Why Apartment Rental Platform FLJ Group (FLJ) Shares Are Rocketing Today - FLJ Group (NASDAQ:FLJ) - Benzinga
Fri, 29 Dec 2023
Why Is FLJ Group (FLJ) Stock Up 10% Today? - InvestorPlace
| Price to Book Value: P/BV, a ratio used to compare book value to its current market price, to gauge whether a stock is valued properly. |
Underperform |
| Price to Earnings: PE, the ratio for valuing a company that measures its current share price relative to its earnings per share (EPS). |
Underperform |
| Discounted cash flow: DCF, a valuation method used to estimate the value of an investment based on its expected future cash flows. |
Neutral |
| Return on Assets: ROA, indicates how profitable a company is in relation to its total assets, how efficiently uses assets to generate a profit. |
Underperform |
| Return on Equity: ROE, a measure of financial performance calculated by dividing net income by equity. a gauge of profitability and efficiency. |
Underperform |
| Debt to Equity: evaluate financial leverage, reflects the ability of equity to cover outstanding debts in the event of a business downturn. |
Underperform |

|
Exchange:
NASDAQ
|
|
|
Sector:
Real Estate
|
|
|
Industry:
Real Estate - Services
|
|
| Shares Out | 5 (M) |
| Shares Float | 0 (M) |
| Held by Insiders | 0 (%) |
| Held by Institutions | 97 (%) |
| Shares Short | 1 (K) |
| Shares Short P.Month | 0 (K) |
| EPS | -0.82 |
| EPS Est Next Qtrly | 0 |
| EPS Est This Year | 0 |
| EPS Est Next Year | 0 |
| Book Value (p.s.) | -136.04 |
| Profit Margin | 0 % |
| Operating Margin | 0 % |
| Return on Assets (ttm) | -17.8 % |
| Return on Equity (ttm) | 0 % |
| Qtrly Rev. Growth | 0 % |
| Gross Profit (p.s.) | 0 |
| Sales Per Share | 0 |
| EBITDA (p.s.) | 0.35 |
| Qtrly Earnings Growth | 0 % |
| Operating Cash Flow | -40 (M) |
| Levered Free Cash Flow | -4 (M) |
| PE Ratio | -0.73 |
| PEG Ratio | 0 |
| Price to Book value | -0.01 |
| Price to Sales | 0 |
| Price to Cash Flow | -0.07 |
| Dividend | 123590 |
| Forward Dividend | 109850 |
| Dividend Yield | 21126500% |
| Dividend Pay Date | Invalid DateTime. |
| Ex-Dividend Date | Invalid DateTime. |