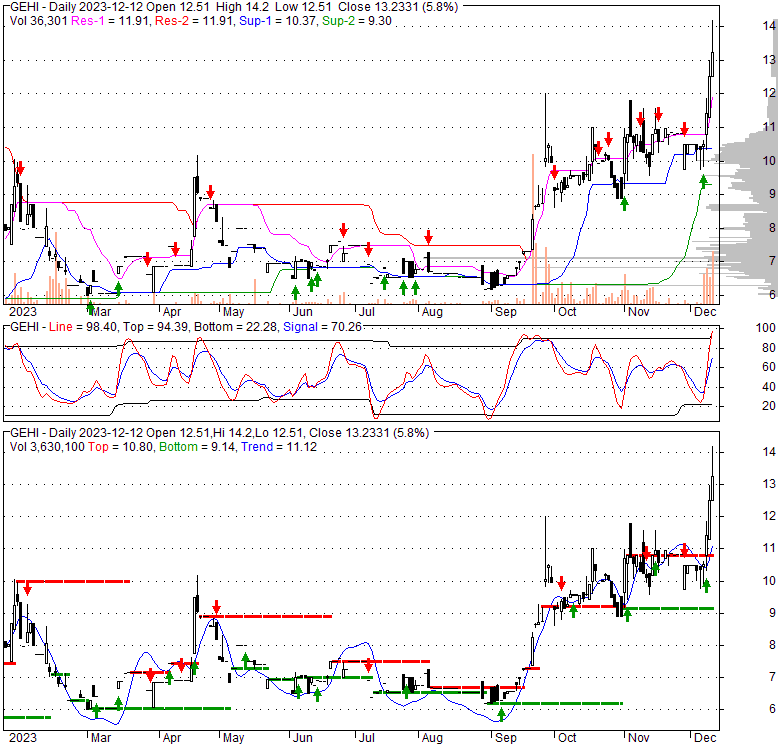
| 13.2331 0.723 (5.78%) | 12-12 15:59 | |||||||||||||
|
|
| Short term | |
|||
| Mid term | |
|||
| Targets | 6-month : | 16.58 |
1-year : | 19.37 |
| Resists | First : | 14.19 |
Second : | 16.58 |
| Pivot price | 10.95 |
|||
| Supports | First : | 11.32 |
Second : | 9.55 |
| MAs | MA(5) : | 11.59 |
MA(20) : | 10.91 |
| MA(100) : | 8.67 |
MA(250) : | 7.72 |
|
| MACD | MACD : | 0.4 |
Signal : | 0.2 |
| %K %D | K(14,3) : | 80.1 |
D(3) : | 70.9 |
| RSI | RSI(14): 79.3 |
|||
| 52-week | High : | 14.19 | Low : | 5.66 |
Price has closed above its short-term moving average. Short-term moving average is currently above mid-term; and above long-term moving average. From the relationship between price and moving averages: This stock is BULLISH in short-term; and BULLISH in mid-long term.[ GEHI ] has closed It is unclear right now based on current values. 89.7% wider than normal. The large width of the bands suggest high volatility as compared to its normal range. The bands have been in this wide range for 0 days. This is a sign that the current trend might continue.
| If tomorrow: | Open lower | Open higher |
| High: | 14.21 - 14.25 | 14.25 - 14.3 |
| Low: | 12.39 - 12.44 | 12.44 - 12.49 |
| Close: | 13.15 - 13.22 | 13.22 - 13.3 |
Gravitas Education Holdings, Inc. provides early childhood education services in the People's Republic of China. It operates play-and-learn centers that offer services for the joint participation of 0-6-year-old children and their adult family members to promote children's development, foster bonding with family, and prepare them for their entry into kindergartens and primary schools. The company also operates student care centers; and provides course content, training, support and guidance, and other services to franchisees and licensees. In addition, it develops and sells educational products and services; and distributes merchandise, such as teaching aids, educational toys, at-home educational products, and school uniforms through franchisees and other business partners, as well as directly to a market of families. Further, the company operates Qingtian Youpin, an e-commerce platform for maternity and children's products. As of December 31, 2021, it operated 1,017 play-and-learn centers and 54 student care centers. The company was formerly known as RYB Education, Inc. and changed its name to Gravitas Education Holdings, Inc. in May 2022. Gravitas Education Holdings, Inc. was founded in 1998 and is based in Beijing, China.
Wed, 13 Dec 2023
NetDragon Announces Completion of Merger for Spinoff Listing of Overseas Education Business - PR Newswire
Wed, 01 Nov 2023
Gravitas Education (NYSE: GEHI) to fall 50% today - Do not panic - Dhaka Tribune
Wed, 19 Apr 2023
Promethean Set to Operate as a Standalone Company with New Merger Agreement - PR Newswire
Tue, 18 Apr 2023
NetDragon announces signing of Merger Agreement to Spinoff Overseas Education Business for listing on NYSE USA ... - PR Newswire
Tue, 10 Jan 2023
Here's What's Concerning About Gravitas Education Holdings' (NYSE:GEHI) Returns On Capital - Yahoo Lifestyle Australia
| Price to Book Value: P/BV, a ratio used to compare book value to its current market price, to gauge whether a stock is valued properly. |
Neutral |
| Price to Earnings: PE, the ratio for valuing a company that measures its current share price relative to its earnings per share (EPS). |
Neutral |
| Discounted cash flow: DCF, a valuation method used to estimate the value of an investment based on its expected future cash flows. |
Neutral |
| Return on Assets: ROA, indicates how profitable a company is in relation to its total assets, how efficiently uses assets to generate a profit. |
Neutral |
| Return on Equity: ROE, a measure of financial performance calculated by dividing net income by equity. a gauge of profitability and efficiency. |
Neutral |
| Debt to Equity: evaluate financial leverage, reflects the ability of equity to cover outstanding debts in the event of a business downturn. |
Neutral |

|
Exchange:
NYSE
|
|
|
Sector:
Consumer Defensive
|
|
|
Industry:
Education & Training Services
|
|
| Shares Out | 3 (M) |
| Shares Float | 8 (M) |
| Held by Insiders | 0 (%) |
| Held by Institutions | 11.6 (%) |
| Shares Short | 10 (K) |
| Shares Short P.Month | 6 (K) |
| EPS | -27.4 |
| EPS Est Next Qtrly | 0 |
| EPS Est This Year | 0 |
| EPS Est Next Year | 0 |
| Book Value (p.s.) | 7.34 |
| Profit Margin | -137.8 % |
| Operating Margin | -18.3 % |
| Return on Assets (ttm) | -7.3 % |
| Return on Equity (ttm) | -135.7 % |
| Qtrly Rev. Growth | -39.1 % |
| Gross Profit (p.s.) | 0 |
| Sales Per Share | 19.11 |
| EBITDA (p.s.) | -3.74 |
| Qtrly Earnings Growth | 0 % |
| Operating Cash Flow | 0 (M) |
| Levered Free Cash Flow | 0 (M) |
| PE Ratio | -0.49 |
| PEG Ratio | 0 |
| Price to Book value | 1.8 |
| Price to Sales | 0.69 |
| Price to Cash Flow | 0 |
| Dividend | 0 |
| Forward Dividend | 0 |
| Dividend Yield | 0% |
| Dividend Pay Date | Invalid DateTime. |
| Ex-Dividend Date | Invalid DateTime. |