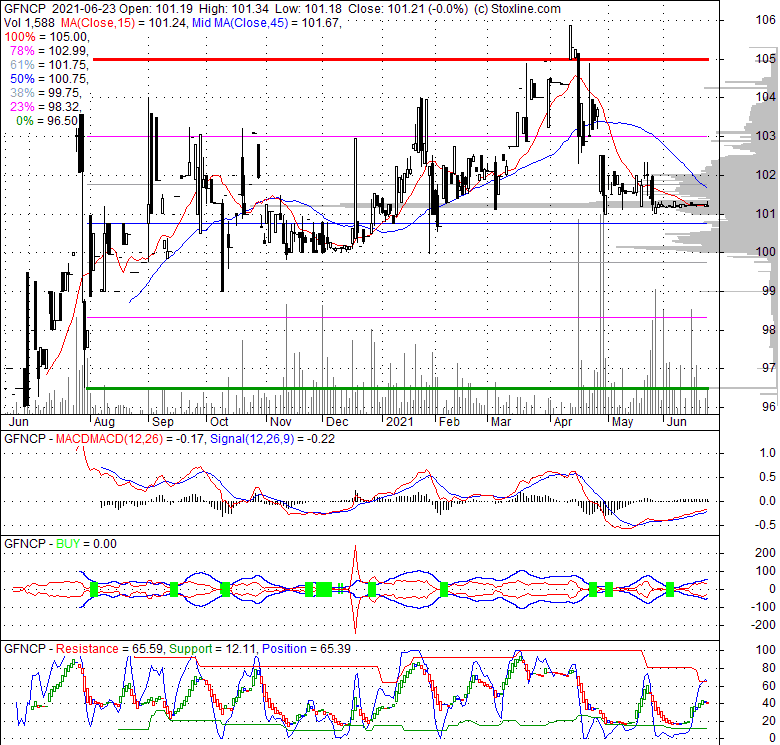
| 101.21 0.02 (0.02%) | 12-31 19:00 | |||||||||||||
|
|
| Short term | |
|||
| Mid term | |
|||
| Targets | 6-month : | 1-year : | ||
| Resists | First : | Second : | ||
| Pivot price | ||||
| Supports | First : | Second : | ||
| MAs | MA(5) : | MA(20) : | ||
| MA(100) : | MA(250) : | |||
| MACD | MACD : | Signal : | ||
| %K %D | K(14,3) : | D(3) : | ||
| RSI | RSI(14): | |||
| 52-week | High : | Low : | ||
| If tomorrow: | Open lower | Open higher |
| High: | - | - |
| Low: | - | - |
| Close: | - | - |
General Finance Corporation, a specialty rental services company, provides portable storage, modular space, and liquid containment solutions in North America and the Asia-Pacific regions. The company's portable storage products include storage containers for classroom equipment storage, construction equipment and tool storage, disaster shelters, landscaping sheds, recreational equipment storage, and retail inventory storage applications; and freight containers used in freight transportation. Its modular space products comprise office or portable building containers, ground level offices, and modular buildings and offices for use in general administrative office spaces, military installations, workforce living accommodations, bank branches, classrooms/education, construction offices, day-care facilities, dormitories, general administrative office space, healthcare and rental facilities, retail space, and shelters. The company's liquid containment products consist of portable liquid storage tanks for well-site liquid containment needs, expansion/upgrade projects, highway construction/groundwater sewage, infrastructure projects, major industrial projects, mining pit pump works, municipal sewer and water projects, non-residential construction projects, pipeline construction and maintenance, and refinery turnarounds. It also provides steps, ramps, furniture, portable toilets, security systems, shelving, mud pumps, hoses, splitter valves, tee connectors, and other items used in connection with leased equipment. In addition, the company offers temporary prison holding cells, hoarding units, blast-resistant units, workforce living accommodations, temporary retail frontage units, and observatory units customized from storage containers, as well as shipping container modifications, specialty trailers and tanks, chassis, storm shelters, and trash hoppers. The company was founded in 2005 and is headquartered in Pasadena, California.
| Price to Book Value: P/BV, a ratio used to compare book value to its current market price, to gauge whether a stock is valued properly. |
Outperform |
| Price to Earnings: PE, the ratio for valuing a company that measures its current share price relative to its earnings per share (EPS). |
Outperform |
| Discounted cash flow: DCF, a valuation method used to estimate the value of an investment based on its expected future cash flows. |
Outperform |
| Return on Assets: ROA, indicates how profitable a company is in relation to its total assets, how efficiently uses assets to generate a profit. |
Neutral |
| Return on Equity: ROE, a measure of financial performance calculated by dividing net income by equity. a gauge of profitability and efficiency. |
Neutral |
| Debt to Equity: evaluate financial leverage, reflects the ability of equity to cover outstanding debts in the event of a business downturn. |
Outperform |

|
Exchange:
NASDAQ
|
|
|
Sector:
Industrials
|
|
|
Industry:
Rental & Leasing Services
|
|
| Shares Out | 0 (M) |
| Shares Float | 0 (M) |
| Held by Insiders | (%) |
| Held by Institutions | (%) |
| Shares Short | 0 (K) |
| Shares Short P.Month | 0 (K) |
| EPS | |
| EPS Est Next Qtrly | |
| EPS Est This Year | |
| EPS Est Next Year | |
| Book Value (p.s.) | |
| Profit Margin | % |
| Operating Margin | % |
| Return on Assets (ttm) | % |
| Return on Equity (ttm) | % |
| Qtrly Rev. Growth | % |
| Gross Profit (p.s.) | |
| Sales Per Share | |
| EBITDA (p.s.) | |
| Qtrly Earnings Growth | % |
| Operating Cash Flow | 0 (M) |
| Levered Free Cash Flow | 0 (M) |
| PE Ratio | |
| PEG Ratio | |
| Price to Book value | |
| Price to Sales | |
| Price to Cash Flow |
| Dividend | |
| Forward Dividend | |
| Dividend Yield | 0% |
| Dividend Pay Date | |
| Ex-Dividend Date |