| 0 (0%) | 04-25 10:45 | |||||||||||||
|
|
| Short term | |
|||
| Mid term | |
|||
| Targets | 6-month : | 0.74 |
1-year : | 0.81 |
| Resists | First : | 0.63 |
Second : | 0.69 |
| Pivot price | 0.57 |
|||
| Supports | First : | 0.53 |
Second : | 0.44 |
| MAs | MA(5) : | 0.55 |
MA(20) : | 0.59 |
| MA(100) : | 0.64 |
MA(250) : | 0.83 |
|
| MACD | MACD : | -0.1 |
Signal : | -0.1 |
| %K %D | K(14,3) : | 16 |
D(3) : | 10.3 |
| RSI | RSI(14): 40.2 |
|||
| 52-week | High : | 1.35 | Low : | 0.51 |
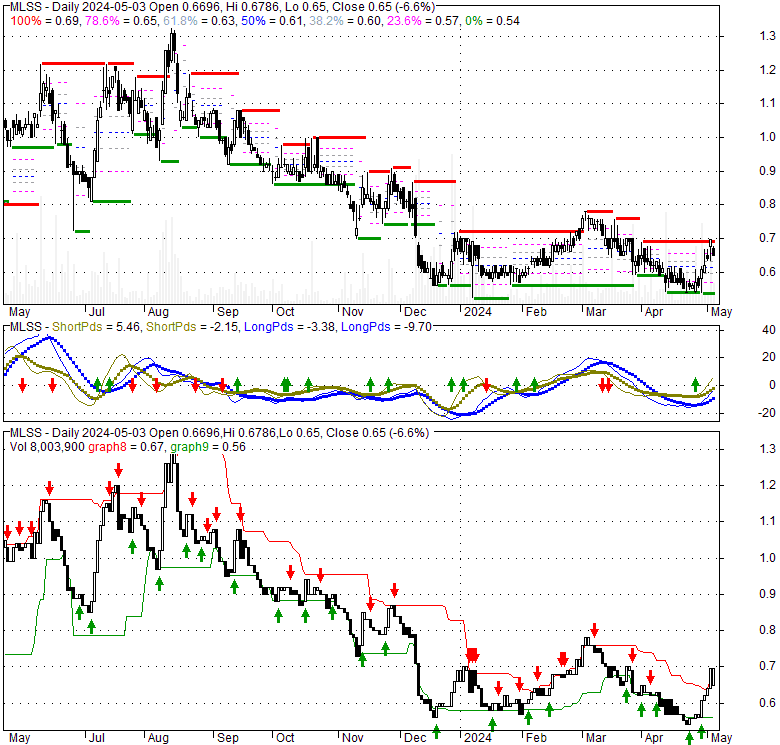
Price has closed above its short-term moving average. Short-term moving average is currently below mid-term; and below long-term moving average. From the relationship between price and moving averages: This stock is NEUTRAL in short-term; and NEUTRAL in mid-long term.[ MLSS ] has closed above bottom band by 31.1%. Bollinger Bands are 32% narrower than normal. The current width of the bands does not suggest anything about the future direction or movement of prices.
| If tomorrow: | Open lower | Open higher |
| High: | 0.57 - 0.57 | 0.57 - 0.58 |
| Low: | 0.54 - 0.55 | 0.55 - 0.55 |
| Close: | 0.55 - 0.56 | 0.56 - 0.56 |
Mon, 06 Nov 2023
Revolutionizing Sulfur Analysis in Petroleum Products: Hobré Instruments’ Cutting-Edge XRF Method - Canadian ... - EnergyNow
Thu, 26 Oct 2023
High Latitude Wide Area Survey - Science@NASA
Wed, 02 Aug 2023
Griffith students podcast not lost in translation - Griffith News
Wed, 17 Aug 2022
Health Link evacuates staff from Lafon County after attack - Radio Tamazuj
Tue, 27 Oct 2015
The WSJ's Hedge Fund Priest Has A Terrible Trade Under His Robe - Forbes
Mon, 01 Jun 2015
Big Investor Threatens Lawsuit Over $1.4 Billion Deal Linked to Ocwen, Fortress - TheStreet
| Price to Book Value: P/BV, a ratio used to compare book value to its current market price, to gauge whether a stock is valued properly. |
Neutral |
| Price to Earnings: PE, the ratio for valuing a company that measures its current share price relative to its earnings per share (EPS). |
Neutral |
| Discounted cash flow: DCF, a valuation method used to estimate the value of an investment based on its expected future cash flows. |
Neutral |
| Return on Assets: ROA, indicates how profitable a company is in relation to its total assets, how efficiently uses assets to generate a profit. |
Neutral |
| Return on Equity: ROE, a measure of financial performance calculated by dividing net income by equity. a gauge of profitability and efficiency. |
Neutral |
| Debt to Equity: evaluate financial leverage, reflects the ability of equity to cover outstanding debts in the event of a business downturn. |
Neutral |
|
Exchange:
|
|
|
Sector:
|
|
|
Industry:
|
|
| Shares Out | 71 (M) |
| Shares Float | 56 (M) |
| Held by Insiders | 15.9 (%) |
| Held by Institutions | 6.3 (%) |
| Shares Short | 460 (K) |
| Shares Short P.Month | 565 (K) |
| EPS | -0.1 |
| EPS Est Next Qtrly | 0 |
| EPS Est This Year | 0 |
| EPS Est Next Year | 0 |
| Book Value (p.s.) | 0.1 |
| Profit Margin | -71.1 % |
| Operating Margin | -73.2 % |
| Return on Assets (ttm) | -34.6 % |
| Return on Equity (ttm) | -77.2 % |
| Qtrly Rev. Growth | -7.1 % |
| Gross Profit (p.s.) | 0 |
| Sales Per Share | 0.13 |
| EBITDA (p.s.) | -0.1 |
| Qtrly Earnings Growth | 0 % |
| Operating Cash Flow | -5 (M) |
| Levered Free Cash Flow | -3 (M) |
| PE Ratio | -6.23 |
| PEG Ratio | 0 |
| Price to Book value | 5.59 |
| Price to Sales | 4.05 |
| Price to Cash Flow | -7.7 |
| Dividend | 0 |
| Forward Dividend | 0 |
| Dividend Yield | 0% |
| Dividend Pay Date | Invalid DateTime. |
| Ex-Dividend Date | Invalid DateTime. |

|

|
|

|
|
|
|
|
|