| 10.9 -0.05 (-0.46%) | 04-18 14:55 | |||||||||||||
|
|
| Short term | ||||
| Mid term | ||||
| Targets | 6-month : | 13.04 | 1-year : | 15.23 |
| Resists | First : | 11.17 | Second : | 13.04 |
| Pivot price | 10.94 |
|||
| Supports | First : | 7.37 | Second : | 5.03 |
| MAs | MA(5) : | 10.93 |
MA(20) : | 10.95 |
| MA(100) : | 10.95 |
MA(250) : | 10.85 |
|
| MACD | MACD : | 0 |
Signal : | 0 |
| %K %D | K(14,3) : | 0 | D(3) : | 0 |
| RSI | RSI(14): 50.1 |
|||
| 52-week | High : | 12.11 | Low : | 5.03 |
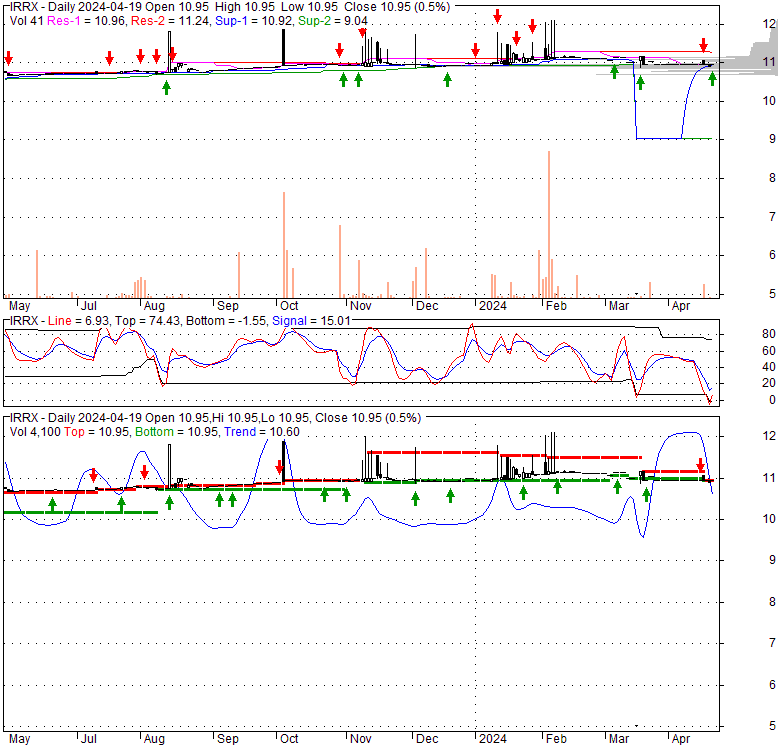
Price has closed below its short-term moving average. Short-term moving average is currently above mid-term; and below long-term moving average. From the relationship between price and moving averages: This stock is NEUTRAL in short-term; and NEUTRAL in mid-long term.[ IRRX ] has closed below the lower bollinger band by 43.5%. Bollinger Bands are 95.1% narrower than normal. The narrow width of the bands suggests low volatility as compared to its normal range. The bands have been in this narrow range for 6 bars. This is a sign that the market may be about to initiate a new trend.
| If tomorrow: | Open lower | Open higher |
| High: | 10.98 - 11.03 | 11.03 - 11.07 |
| Low: | 10.75 - 10.82 | 10.82 - 10.88 |
| Close: | 10.8 - 10.91 | 10.91 - 11 |
Integrated Rail and Resources Acquisition Corp. does not have significant operations. It focuses on effecting a merger, capital stock exchange, asset acquisition, stock purchase, reorganization, or similar business combination with one or more businesses in railroad companies in North America. The company was incorporated in 2021 and is based in Fort Worth, Texas.
Wed, 17 Apr 2024
What Kind Of Shareholders Own Integrated Rail and Resources Acquisition Corp. (NYSE:IRRX)? - Yahoo Movies UK
Thu, 15 Feb 2024
Integrated Rail and Resources Acquisition Wins 9 Month Extension, Loses 37% of Remaining Trust | DealFlow's SPAC ... - DealFlow's SPAC News
Wed, 23 Nov 2022
People News: WSP USA, HNTB, Integrated Rail and Resources Acquisition Corp. - RailwayAge Magazine
Mon, 21 Nov 2022
Integrated Rail and Resources Acquisition Corp. Announces Changes to Board and Senior Management - Business Wire
Tue, 04 Jan 2022
Still No 2022 SPAC Deal Announcements - Boardroom Alpha - TheStreet
Tue, 16 Nov 2021
Integrated Rail and Resources Acquisition Corp. Announces Closing of $230 Million Initial Public Offering - Business Wire
| Price to Book Value: P/BV, a ratio used to compare book value to its current market price, to gauge whether a stock is valued properly. |
Outperform |
| Price to Earnings: PE, the ratio for valuing a company that measures its current share price relative to its earnings per share (EPS). |
Outperform |
| Discounted cash flow: DCF, a valuation method used to estimate the value of an investment based on its expected future cash flows. |
Neutral |
| Return on Assets: ROA, indicates how profitable a company is in relation to its total assets, how efficiently uses assets to generate a profit. |
Outperform |
| Return on Equity: ROE, a measure of financial performance calculated by dividing net income by equity. a gauge of profitability and efficiency. |
Outperform |
| Debt to Equity: evaluate financial leverage, reflects the ability of equity to cover outstanding debts in the event of a business downturn. |
Neutral |
|
Exchange:
NYSE
|
|
|
Sector:
Financial Services
|
|
|
Industry:
Shell Companies
|
|
| Shares Out | 6 (M) |
| Shares Float | 5 (M) |
| Held by Insiders | 0 (%) |
| Held by Institutions | 283.5 (%) |
| Shares Short | 1 (K) |
| Shares Short P.Month | 2 (K) |
| EPS | -0.01 |
| EPS Est Next Qtrly | 0 |
| EPS Est This Year | 0 |
| EPS Est Next Year | 0 |
| Book Value (p.s.) | -1.68 |
| Profit Margin | 0 % |
| Operating Margin | 0 % |
| Return on Assets (ttm) | -0.9 % |
| Return on Equity (ttm) | 0 % |
| Qtrly Rev. Growth | 0 % |
| Gross Profit (p.s.) | 0 |
| Sales Per Share | 0 |
| EBITDA (p.s.) | 0 |
| Qtrly Earnings Growth | 44.2 % |
| Operating Cash Flow | -2 (M) |
| Levered Free Cash Flow | 2 (M) |
| PE Ratio | -1090 |
| PEG Ratio | 0 |
| Price to Book value | -6.49 |
| Price to Sales | 0 |
| Price to Cash Flow | -45.06 |
| Dividend | 0 |
| Forward Dividend | 0 |
| Dividend Yield | 0% |
| Dividend Pay Date | Invalid DateTime. |
| Ex-Dividend Date | Invalid DateTime. |

|

|
|

|
|
|
|
|
|