| 10.17 0.005 (0.05%) | 03-28 13:35 | |||||||||||||
|
|
| Short term | ||||
| Mid term | ||||
| Targets | 6-month : | 11.92 | 1-year : | 13.92 |
| Resists | First : | 10.21 | Second : | 11.92 |
| Pivot price | 10.17 |
|||
| Supports | First : | 9.86 | Second : | 9.64 |
| MAs | MA(5) : | 10.17 | MA(20) : | 10.15 |
| MA(100) : | 9.86 |
MA(250) : | 10.14 |
|
| MACD | MACD : | 0 |
Signal : | 0 |
| %K %D | K(14,3) : | 32.7 |
D(3) : | 52.4 |
| RSI | RSI(14): 55.4 | |||
| 52-week | High : | 12.02 | Low : | 9.1 |
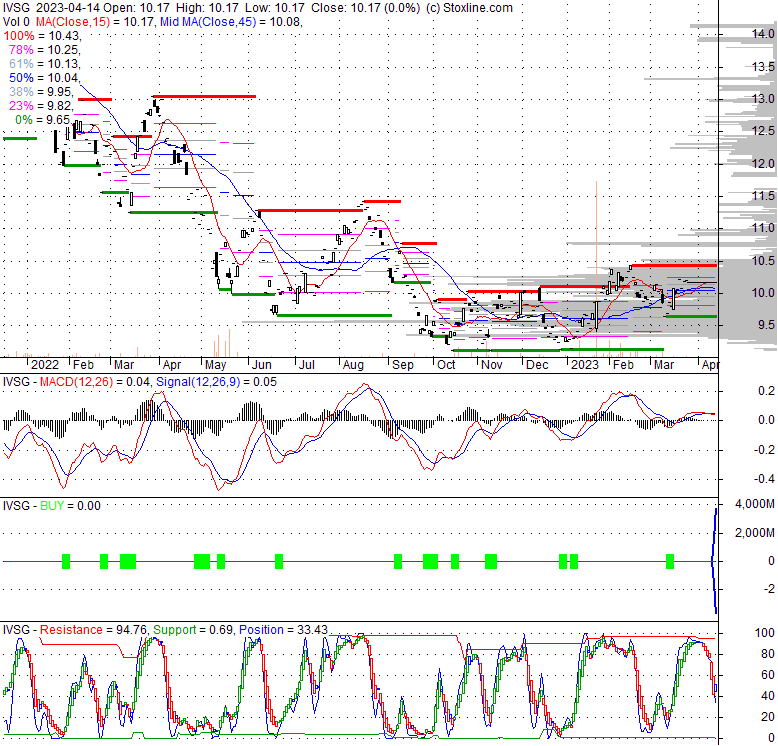
Price has closed below its short-term moving average. Short-term moving average is currently above mid-term; and above long-term moving average. From the relationship between price and moving averages: This stock is NEUTRAL in short-term; and BULLISH in mid-long term.[ IVSG ] has closed above bottom band by 43.5%. Bollinger Bands are 94.6% narrower than normal. The narrow width of the bands suggests low volatility as compared to its normal range. The bands have been in this narrow range for 7 bars. This is a sign that the market may be about to initiate a new trend.
| If tomorrow: | Open lower | Open higher |
| High: | 10.19 - 10.24 | 10.24 - 10.28 |
| Low: | 10.03 - 10.1 | 10.1 - 10.15 |
| Close: | 10.07 - 10.18 | 10.18 - 10.26 |
The fund seeks to achieve its investment objective by investing primarily in exchange-traded common stocks of U.S. companies that the Sub-Adviser believes have potential for earnings or revenue growth. It may invest in securities of issuers of all capitalization sizes; however, it will primarily hold securities of large and mid-capitalization issuers. The fund usually will hold a relatively small number of stocks (approximately 25-30) and may invest more than 25% of its assets in a given sector. It is non-diversified.
Wed, 25 Jan 2023
Invesco to liquidate 14% of Americas product lineup - Citywire Professional Buyer
Wed, 25 Jan 2023
Invesco to Close 26 ETFs in Shakeup of Its Listings - Yahoo Finance
Tue, 22 Dec 2020
Invesco Launches its First Active Non-transparent ETFs - PR Newswire
Tue, 22 Dec 2020
Invesco Debuts 4 Active Non-Transparent ETFs - ETF Trends
Sat, 13 Aug 2016
Monolithic Power Systems (MPWR) Stock Price, News & Analysis - MarketBeat
Fri, 12 Aug 2016
PENN Entertainment (PENN) Stock Price, News & Analysis - MarketBeat
| Price to Book Value: P/BV, a ratio used to compare book value to its current market price, to gauge whether a stock is valued properly. |
Neutral |
| Price to Earnings: PE, the ratio for valuing a company that measures its current share price relative to its earnings per share (EPS). |
Neutral |
| Discounted cash flow: DCF, a valuation method used to estimate the value of an investment based on its expected future cash flows. |
Neutral |
| Return on Assets: ROA, indicates how profitable a company is in relation to its total assets, how efficiently uses assets to generate a profit. |
Neutral |
| Return on Equity: ROE, a measure of financial performance calculated by dividing net income by equity. a gauge of profitability and efficiency. |
Neutral |
| Debt to Equity: evaluate financial leverage, reflects the ability of equity to cover outstanding debts in the event of a business downturn. |
Neutral |
|
Exchange:
ETF
|
|
|
Sector:
|
|
|
Industry:
|
|
| Shares Out | 0 (M) |
| Shares Float | 0 (M) |
| Held by Insiders | 0 (%) |
| Held by Institutions | 0 (%) |
| Shares Short | 0 (K) |
| Shares Short P.Month | 0 (K) |
| EPS | 0 |
| EPS Est Next Qtrly | 0 |
| EPS Est This Year | 0 |
| EPS Est Next Year | 0 |
| Book Value (p.s.) | 0 |
| Profit Margin | 0 % |
| Operating Margin | 0 % |
| Return on Assets (ttm) | 0 % |
| Return on Equity (ttm) | 0 % |
| Qtrly Rev. Growth | 0 % |
| Gross Profit (p.s.) | 0 |
| Sales Per Share | 0 |
| EBITDA (p.s.) | 0 |
| Qtrly Earnings Growth | 0 % |
| Operating Cash Flow | 0 (M) |
| Levered Free Cash Flow | 0 (M) |
| PE Ratio | 0 |
| PEG Ratio | 0 |
| Price to Book value | 0 |
| Price to Sales | 0 |
| Price to Cash Flow | 0 |
| Dividend | 0 |
| Forward Dividend | 0 |
| Dividend Yield | 0% |
| Dividend Pay Date | Invalid DateTime. |
| Ex-Dividend Date | Invalid DateTime. |

|

|
|

|
|
|
|
|
|