| 0 (0%) | 04-23 22:19 | |||||||||||||
|
|
| Short term | |
|||
| Mid term | ||||
| Targets | 6-month : | 69.36 | 1-year : | 81.02 |
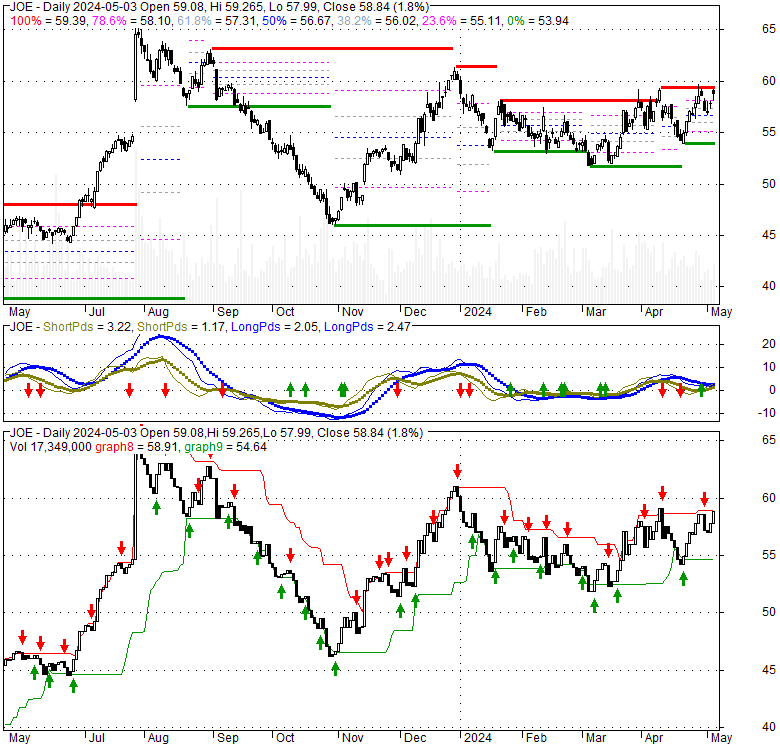
| Resists | First : | 59.38 | Second : | 69.36 |
| Pivot price | 56.52 |
|||
| Supports | First : | 55.24 |
Second : | 52.68 |
| MAs | MA(5) : | 55.37 |
MA(20) : | 56.61 |
| MA(100) : | 55.63 |
MA(250) : | 53.31 |
|
| MACD | MACD : | 0.1 |
Signal : | 0.3 |
| %K %D | K(14,3) : | 37.6 |
D(3) : | 21.4 |
| RSI | RSI(14): 54.4 |
|||
| 52-week | High : | 65.98 | Low : | 38.81 |
Price has closed above its short-term moving average. Short-term moving average is currently above mid-term; and below long-term moving average. From the relationship between price and moving averages: This stock is BULLISH in short-term; and NEUTRAL in mid-long term.[ JOE ] has closed below upper band by 40.0%. Bollinger Bands are 4% narrower than normal. The current width of the bands does not suggest anything about the future direction or movement of prices.
| If tomorrow: | Open lower | Open higher |
| High: | 57.37 - 57.6 | 57.6 - 57.84 |
| Low: | 55.52 - 55.76 | 55.76 - 56.01 |
| Close: | 56.63 - 57.05 | 57.05 - 57.48 |
Fri, 11 Aug 2023
MediaMath Founder Joe Zawadzki Launches 'Project Phoenix' to Buy Back Bankrupt Company - Business Insider
Tue, 14 Feb 2023
Lady Rangers topple UH; Rangers take down 'Landers - Elizabethton.com
Fri, 14 Oct 2022
Joe Zimmerman - National Association of REALTORS®
Thu, 28 Jul 2022
Joe-Z Blamo | | johnsoncitypress.com - Johnson City Press
Thu, 12 May 2022
The Yankees Fan Yankees Fans Like to Watch Watching the Yankees - The New Yorker
Thu, 20 Jan 2022
A Visionary Without a Country — ProPublica - ProPublica
| Price to Book Value: P/BV, a ratio used to compare book value to its current market price, to gauge whether a stock is valued properly. |
Neutral |
| Price to Earnings: PE, the ratio for valuing a company that measures its current share price relative to its earnings per share (EPS). |
Neutral |
| Discounted cash flow: DCF, a valuation method used to estimate the value of an investment based on its expected future cash flows. |
Neutral |
| Return on Assets: ROA, indicates how profitable a company is in relation to its total assets, how efficiently uses assets to generate a profit. |
Neutral |
| Return on Equity: ROE, a measure of financial performance calculated by dividing net income by equity. a gauge of profitability and efficiency. |
Neutral |
| Debt to Equity: evaluate financial leverage, reflects the ability of equity to cover outstanding debts in the event of a business downturn. |
Neutral |
|
Exchange:
|
|
|
Sector:
|
|
|
Industry:
|
|
| Shares Out | 58 (M) |
| Shares Float | 56 (M) |
| Held by Insiders | 0.2 (%) |
| Held by Institutions | 86.8 (%) |
| Shares Short | 558 (K) |
| Shares Short P.Month | 636 (K) |
| EPS | 1.33 |
| EPS Est Next Qtrly | 0 |
| EPS Est This Year | 0 |
| EPS Est Next Year | 0 |
| Book Value (p.s.) | 11.69 |
| Profit Margin | 19.9 % |
| Operating Margin | 19.9 % |
| Return on Assets (ttm) | 3.8 % |
| Return on Equity (ttm) | 10.9 % |
| Qtrly Rev. Growth | 40.7 % |
| Gross Profit (p.s.) | 0 |
| Sales Per Share | 6.66 |
| EBITDA (p.s.) | 2.21 |
| Qtrly Earnings Growth | -54.3 % |
| Operating Cash Flow | 104 (M) |
| Levered Free Cash Flow | 6 (M) |
| PE Ratio | 42.87 |
| PEG Ratio | 0 |
| Price to Book value | 4.87 |
| Price to Sales | 8.55 |
| Price to Cash Flow | 32.07 |
| Dividend | 0 |
| Forward Dividend | 0 |
| Dividend Yield | 0% |
| Dividend Pay Date | Invalid DateTime. |
| Ex-Dividend Date | Invalid DateTime. |

|

|
|

|
|
|
|
|
|