| 25.8969 0.134 (0.52%) | 04-17 10:53 | |||||||||||||
|
|
| Short term | ||||
| Mid term | |
|||
| Targets | 6-month : | 30.84 |
1-year : | 31.32 |
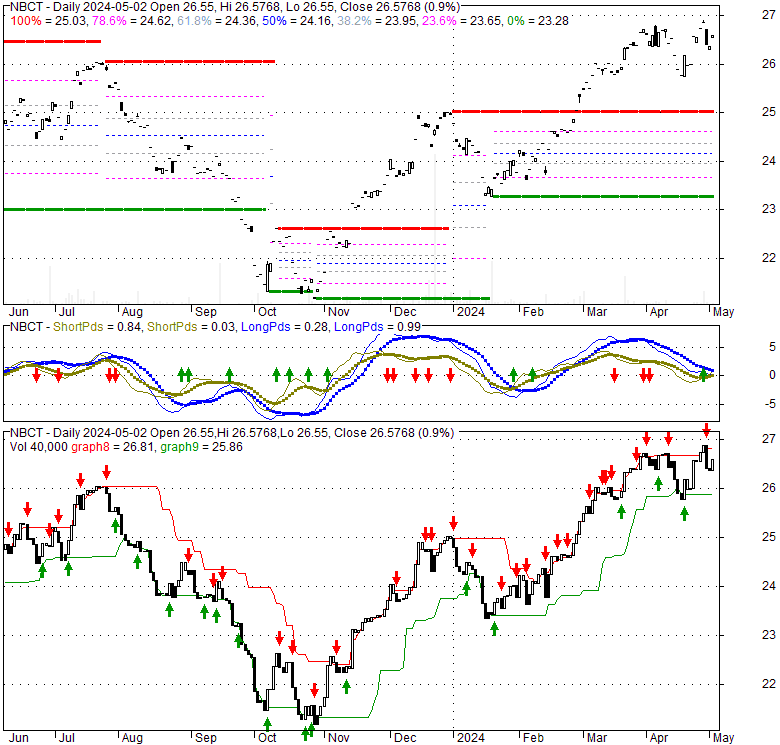
| Resists | First : | 26.41 |
Second : | 26.81 |
| Pivot price | 26.42 |
|||
| Supports | First : | 25.75 |
Second : | 21.42 |
| MAs | MA(5) : | 26.15 |
MA(20) : | 26.35 |
| MA(100) : | 24.77 |
MA(250) : | 24.26 |
|
| MACD | MACD : | 0.1 |
Signal : | 0.2 |
| %K %D | K(14,3) : | 42.1 |
D(3) : | 48.3 |
| RSI | RSI(14): 46.8 |
|||
| 52-week | High : | 26.81 | Low : | 21.16 |
Price has closed below its short-term moving average. Short-term moving average is currently above mid-term; and above long-term moving average. From the relationship between price and moving averages: This stock is NEUTRAL in short-term; and BULLISH in mid-long term.[ NBCT ] has closed above bottom band by 1.8%. Bollinger Bands are 21.2% narrower than normal. The current width of the bands does not suggest anything about the future direction or movement of prices.
| If tomorrow: | Open lower | Open higher |
| High: | 26.21 - 26.35 | 26.35 - 26.47 |
| Low: | 25.85 - 26.01 | 26.01 - 26.14 |
| Close: | 25.92 - 26.19 | 26.19 - 26.42 |
Under normal market conditions, the fund invests at least 80% of its net assets (plus borrowing for investment purposes) in equity securities of carbon transition companies and infrastructure companies. It invests a significant portion of its assets in carbon transition companies, which the Managers consider to be those companies that have, or in the Portfolio Managers’ view, are reasonably expected to have, at least 20% of their assets or revenue, committed to or derived from infrastructure that will facilitate global decarbonization and/or the reduction of other greenhouse gas emissions.
Thu, 18 Apr 2024
(NBCT) Trading Advice - Stock Traders Daily
Tue, 26 Mar 2024
Why Sunnova Energy Shares Are Trading Higher Tuesday - Sunnova Energy Intl (NYSE:NOVA) - Benzinga
Wed, 06 Mar 2024
ESG Investing Morphs Into Transition Investing: 3 Funds to Consider - Cabot Wealth Network
Thu, 04 Jan 2024
Q&A: Engagement and ESG innovation in commodities - PA Future - ESG Clarity
Mon, 04 Sep 2023
PGIM launches global all-cap Carbon Solutions Fund - Portfolio Adviser
Mon, 04 Sep 2023
Neuberger Berman launches climate innovation fund - PA Future - ESG Clarity
| Price to Book Value: P/BV, a ratio used to compare book value to its current market price, to gauge whether a stock is valued properly. |
Neutral |
| Price to Earnings: PE, the ratio for valuing a company that measures its current share price relative to its earnings per share (EPS). |
Neutral |
| Discounted cash flow: DCF, a valuation method used to estimate the value of an investment based on its expected future cash flows. |
Neutral |
| Return on Assets: ROA, indicates how profitable a company is in relation to its total assets, how efficiently uses assets to generate a profit. |
Neutral |
| Return on Equity: ROE, a measure of financial performance calculated by dividing net income by equity. a gauge of profitability and efficiency. |
Neutral |
| Debt to Equity: evaluate financial leverage, reflects the ability of equity to cover outstanding debts in the event of a business downturn. |
Neutral |
|
Exchange:
AMEX
|
|
|
Sector:
Financial Services
|
|
|
Industry:
Asset Management
|
|
| Shares Out | 0 (M) |
| Shares Float | 0 (M) |
| Held by Insiders | 0 (%) |
| Held by Institutions | 0 (%) |
| Shares Short | 0 (K) |
| Shares Short P.Month | 0 (K) |
| EPS | 0 |
| EPS Est Next Qtrly | 0 |
| EPS Est This Year | 0 |
| EPS Est Next Year | 0 |
| Book Value (p.s.) | 0 |
| Profit Margin | 0 % |
| Operating Margin | 0 % |
| Return on Assets (ttm) | 0 % |
| Return on Equity (ttm) | 0 % |
| Qtrly Rev. Growth | 0 % |
| Gross Profit (p.s.) | 0 |
| Sales Per Share | 0 |
| EBITDA (p.s.) | 0 |
| Qtrly Earnings Growth | 0 % |
| Operating Cash Flow | 0 (M) |
| Levered Free Cash Flow | 0 (M) |
| PE Ratio | 0 |
| PEG Ratio | 0 |
| Price to Book value | 0 |
| Price to Sales | 0 |
| Price to Cash Flow | 0 |
| Dividend | 0 |
| Forward Dividend | 0 |
| Dividend Yield | 0% |
| Dividend Pay Date | Invalid DateTime. |
| Ex-Dividend Date | Invalid DateTime. |

|

|
|

|
|
|
|
|
|