| 17.2801 -0.12 (-0.69%) | 04-24 16:00 | |||||||||||||
|
|
| Short term | ||||
| Mid term | |
|||
| Targets | 6-month : | 26.08 |
1-year : | 26.89 |
| Resists | First : | 22.33 |
Second : | 23.03 |
| Pivot price | 21.65 |
|||
| Supports | First : | 21.2 | Second : | 17.63 |
| MAs | MA(5) : | 21.69 |
MA(20) : | 21.72 |
| MA(100) : | 23.22 |
MA(250) : | 0 | |
| MACD | MACD : | -0.2 |
Signal : | -0.3 |
| %K %D | K(14,3) : | 52.9 |
D(3) : | 46.8 |
| RSI | RSI(14): 45 |
|||
| 52-week | High : | 25.01 | Low : | 19.64 |
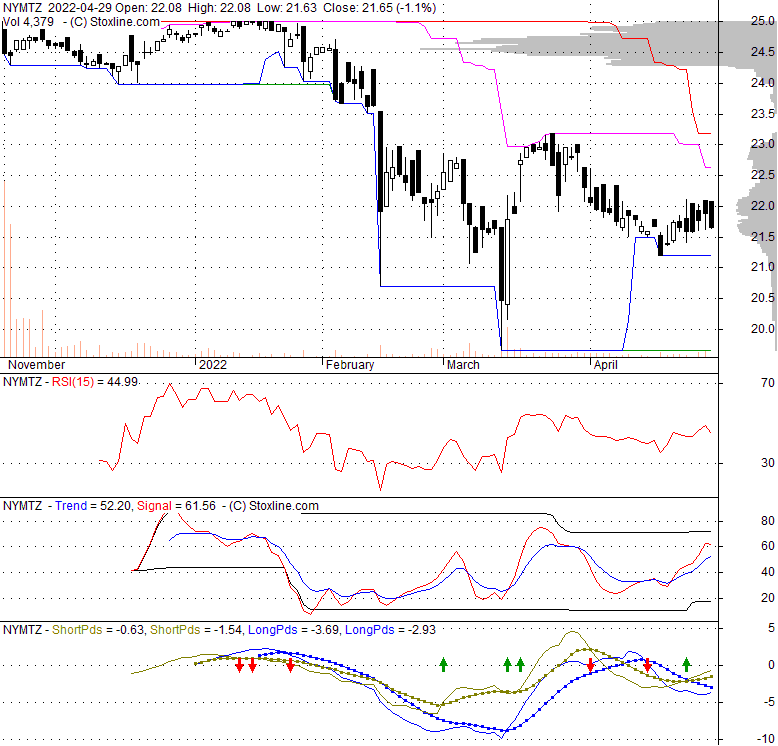
Price has closed below its short-term moving average. Short-term moving average is currently below mid-term; and below long-term moving average. From the relationship between price and moving averages: This stock is BEARISH in short-term; and BEARISH in mid-long term.[ NYMTZ ] has closed above bottom band by 48.7%. Bollinger Bands are 0% narrower than normal.
| If tomorrow: | Open lower | Open higher |
| High: | 22.1 - 22.23 | 22.23 - 22.34 |
| Low: | 21.33 - 21.47 | 21.47 - 21.6 |
| Close: | 21.45 - 21.67 | 21.67 - 21.87 |
New York Mortgage Trust, Inc. acquires, invests in, finances, and manages mortgage-related single-family and multi-family residential assets in the United States. Its targeted investments include residential loans, second mortgages, and business purpose loans; structured multi-family property investments, such as preferred equity in, and mezzanine loans to owners of multi-family properties, as well as joint venture equity investments in multi-family properties; non-agency residential mortgage-backed securities (RMBS); agency RMBS; commercial mortgage-backed securities (CMBS); and other mortgage, residential housing, and credit-related assets. The company qualifies as a real estate investment trust for federal income tax purposes. It generally would not be subject to federal corporate income taxes if it distributes at least 90% of its taxable income to its stockholders. The company was incorporated in 2003 and is headquartered in New York, New York.
Tue, 23 Apr 2024
Learn to Evaluate (NYMTZ) using the Charts - Stock Traders Daily
Tue, 12 Mar 2024
Lords Group Trading (LON:LORD) Trading Up 1.6% - American Banking and Market News - American Banking and Market News
Thu, 22 Feb 2024
New York Mortgage Trust, Inc. 2023 Q4 - Results - Earnings Call Presentation (NASDAQ:NYMT) - Seeking Alpha
Sat, 03 Sep 2022
NYMTM: Price Loss In 2022 Makes This 7.875% Preferred Series Attractive (NASDAQ:NYMTM) - Seeking Alpha
| Price to Book Value: P/BV, a ratio used to compare book value to its current market price, to gauge whether a stock is valued properly. |
Neutral |
| Price to Earnings: PE, the ratio for valuing a company that measures its current share price relative to its earnings per share (EPS). |
Neutral |
| Discounted cash flow: DCF, a valuation method used to estimate the value of an investment based on its expected future cash flows. |
Neutral |
| Return on Assets: ROA, indicates how profitable a company is in relation to its total assets, how efficiently uses assets to generate a profit. |
Neutral |
| Return on Equity: ROE, a measure of financial performance calculated by dividing net income by equity. a gauge of profitability and efficiency. |
Outperform |
| Debt to Equity: evaluate financial leverage, reflects the ability of equity to cover outstanding debts in the event of a business downturn. |
Outperform |
|
Exchange:
NASDAQ
|
|
|
Sector:
Real Estate
|
|
|
Industry:
REIT - Mortgage
|
|
| Shares Out | 0 (M) |
| Shares Float | 376 (M) |
| Held by Insiders | 0 (%) |
| Held by Institutions | 0 (%) |
| Shares Short | 15 (K) |
| Shares Short P.Month | 0 (K) |
| EPS | 0.5 |
| EPS Est Next Qtrly | 0 |
| EPS Est This Year | 0 |
| EPS Est Next Year | 0 |
| Book Value (p.s.) | 4.78 |
| Profit Margin | 74.1 % |
| Operating Margin | 73.9 % |
| Return on Assets (ttm) | 4.9 % |
| Return on Equity (ttm) | 10.1 % |
| Qtrly Rev. Growth | -29.2 % |
| Gross Profit (p.s.) | 0 |
| Sales Per Share | 0 |
| EBITDA (p.s.) | 0 |
| Qtrly Earnings Growth | -58.6 % |
| Operating Cash Flow | 112 (M) |
| Levered Free Cash Flow | 0 (M) |
| PE Ratio | 43.29 |
| PEG Ratio | 0 |
| Price to Book value | 4.51 |
| Price to Sales | 0 |
| Price to Cash Flow | 0 |
| Dividend | 0 |
| Forward Dividend | 0 |
| Dividend Yield | 0% |
| Dividend Pay Date | 2022-01-14 |
| Ex-Dividend Date | 2021-12-29 |

|

|
|

|
|
|
|
|
|