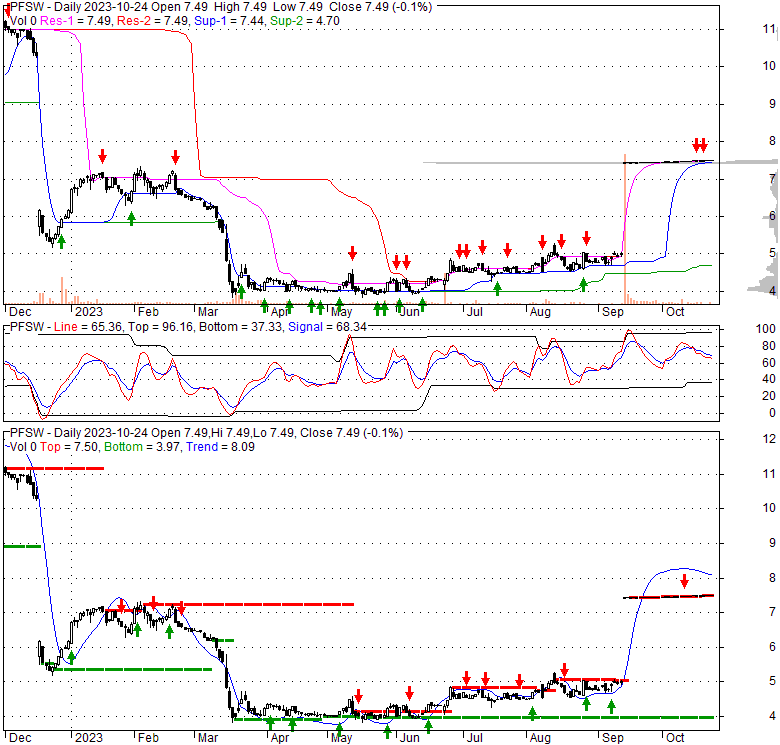
| 7.495 0.005 (0.07%) | 10-23 15:59 | |||||||||||||
|
|
| Short term | |
|||
| Mid term | |
|||
| Targets | 6-month : | 8.76 | 1-year : | 10.23 |
| Resists | First : | 7.5 | Second : | 8.76 |
| Pivot price | 7.47 |
|||
| Supports | First : | 7.44 | Second : | 7.4 |
| MAs | MA(5) : | 7.49 |
MA(20) : | 7.46 |
| MA(100) : | 5.41 |
MA(250) : | 6.12 |
|
| MACD | MACD : | 0.2 |
Signal : | 0.3 |
| %K %D | K(14,3) : | 86.1 |
D(3) : | 84.3 |
| RSI | RSI(14): 80.1 |
|||
| 52-week | High : | 11.44 | Low : | 3.79 |
Price has closed below its short-term moving average. Short-term moving average is currently above mid-term; and above long-term moving average. From the relationship between price and moving averages: This stock is NEUTRAL in short-term; and BULLISH in mid-long term.[ PFSW ] has closed below upper band by 28.3%. Bollinger Bands are 93.4% narrower than normal. The narrow width of the bands suggests low volatility as compared to its normal range. The bands have been in this narrow range for 14 bars. This is a sign that the market may be about to initiate a new trend.
| If tomorrow: | Open lower | Open higher |
| High: | 7.5 - 7.54 | 7.54 - 7.57 |
| Low: | 7.39 - 7.44 | 7.44 - 7.48 |
| Close: | 7.42 - 7.49 | 7.49 - 7.56 |
PFSweb, Inc., together with its subsidiaries, provides omni-channel commerce solutions in the United States, Belgium, Bulgaria, the United Kingdom, Canada, and India. The company offers order to cash service, which provides distributed order orchestration and payment processing; order fulfillment services; contact center services that are focused on providing essential services, such as order entry, returns authorization, product inquiry, and order tracking, as well as iCA, an application where agents provides customer service functions, such as placing orders, checking order status, facilitating returns, initiating upsell and cross sell, managing escalations, and gathering voice of the customer information. It serves clients in various industries, such as fashion apparel and accessories, fragrance and beauty products, health, luxury goods, cosmetics, footwear, consumer packaged goods, housewares, coins and collectibles, jewelry, computer and office products, and other industries. The company was incorporated in 1999 and is headquartered in Allen, Texas.
Tue, 02 Apr 2024
Introducing PFSweb (NASDAQ:PFSW), The Stock That Slid 60% In The Last Five Years - Yahoo Movies UK
Wed, 04 Oct 2023
PFSweb Is Like The Red Rubber Ball (NASDAQ:PFSW) - Seeking Alpha
Tue, 03 Oct 2023
Moore Kuehn Encourages, CEPQ, PFSW, TRHC, and NEWR Investors to Contact Law Firm - PR Newswire
Fri, 15 Sep 2023
GXO Logistics acquires e-commerce fulfillment provider PFSWeb - Westfair Online
Thu, 14 Sep 2023
PFSweb to be Acquired by GXO Logistics - citybiz
Thu, 14 Sep 2023
GXO acquires luxury goods fulfillment provider PFSweb - FreightWaves
| Price to Book Value: P/BV, a ratio used to compare book value to its current market price, to gauge whether a stock is valued properly. |
Neutral |
| Price to Earnings: PE, the ratio for valuing a company that measures its current share price relative to its earnings per share (EPS). |
Underperform |
| Discounted cash flow: DCF, a valuation method used to estimate the value of an investment based on its expected future cash flows. |
Outperform |
| Return on Assets: ROA, indicates how profitable a company is in relation to its total assets, how efficiently uses assets to generate a profit. |
Underperform |
| Return on Equity: ROE, a measure of financial performance calculated by dividing net income by equity. a gauge of profitability and efficiency. |
Underperform |
| Debt to Equity: evaluate financial leverage, reflects the ability of equity to cover outstanding debts in the event of a business downturn. |
Neutral |

|
Exchange:
NASDAQ
|
|
|
Sector:
Industrials
|
|
|
Industry:
Specialty Business Services
|
|
| Shares Out | 23 (M) |
| Shares Float | 11 (M) |
| Held by Insiders | 26.4 (%) |
| Held by Institutions | 80.1 (%) |
| Shares Short | 261 (K) |
| Shares Short P.Month | 333 (K) |
| EPS | -0.44 |
| EPS Est Next Qtrly | 0 |
| EPS Est This Year | 0 |
| EPS Est Next Year | 0 |
| Book Value (p.s.) | 3.75 |
| Profit Margin | -3.2 % |
| Operating Margin | -0.9 % |
| Return on Assets (ttm) | -2.7 % |
| Return on Equity (ttm) | -7.1 % |
| Qtrly Rev. Growth | 6.3 % |
| Gross Profit (p.s.) | 1.93 |
| Sales Per Share | 9.01 |
| EBITDA (p.s.) | -0.08 |
| Qtrly Earnings Growth | 0 % |
| Operating Cash Flow | 8 (M) |
| Levered Free Cash Flow | 2 (M) |
| PE Ratio | -17.42 |
| PEG Ratio | 0 |
| Price to Book value | 1.99 |
| Price to Sales | 0.83 |
| Price to Cash Flow | 21.41 |
| Dividend | 0 |
| Forward Dividend | 0 |
| Dividend Yield | 0% |
| Dividend Pay Date | Invalid DateTime. |
| Ex-Dividend Date | Invalid DateTime. |