| 0.991 0.006 (0.61%) | 08-25 16:00 | |||||||||||||
|
|
| Short term | |
|||
| Mid term | |
|||
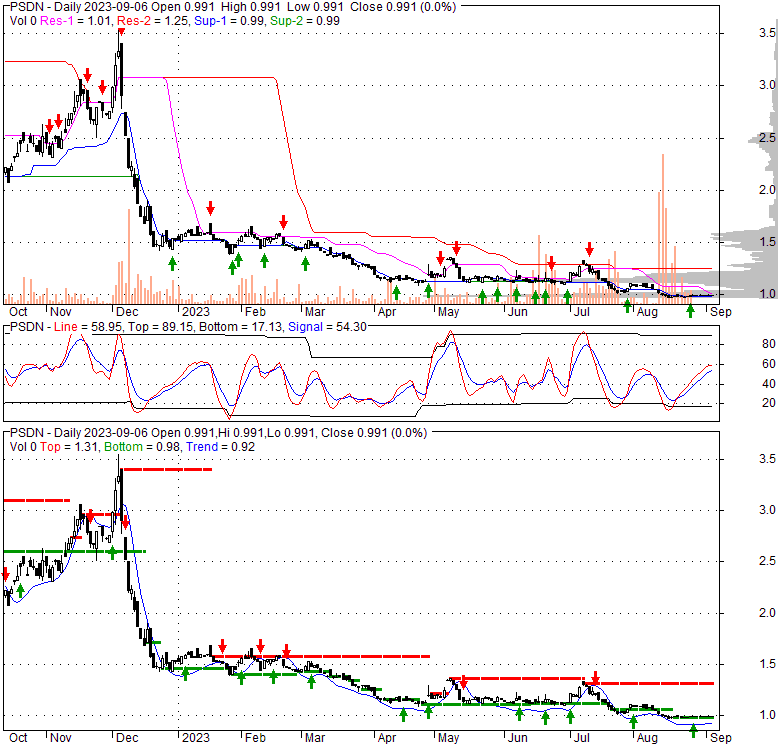
| Targets | 6-month : | 1.23 | 1-year : | 1.29 |
| Resists | First : | 1.05 | Second : | 1.11 |
| Pivot price | 0.98 |
|||
| Supports | First : | 0.96 | Second : | 0.8 |
| MAs | MA(5) : | 0.99 | MA(20) : | 0.99 |
| MA(100) : | 1.12 |
MA(250) : | 1.6 |
|
| MACD | MACD : | -0.1 |
Signal : | -0.1 |
| %K %D | K(14,3) : | 62 |
D(3) : | 50 |
| RSI | RSI(14): 36.1 | |||
| 52-week | High : | 3.63 | Low : | 0.96 |
Price has closed below its short-term moving average. Short-term moving average is currently below mid-term; and below long-term moving average. From the relationship between price and moving averages: This stock is NEUTRAL in short-term; and BEARISH in mid-long term.[ PSDN ] has closed below upper band by 31.9%. Bollinger Bands are 87.5% narrower than normal. The narrow width of the bands suggests low volatility as compared to its normal range. The bands have been in this narrow range for 5 bars. This is a sign that the market may be about to initiate a new trend.
| If tomorrow: | Open lower | Open higher |
| High: | 0.99 - 1 | 1 - 1 |
| Low: | 0.98 - 0.98 | 0.98 - 0.99 |
| Close: | 0.98 - 0.99 | 0.99 - 1 |
The fund is an actively managed exchange-traded fund (“ETF”) that seeks to invests, under normal circumstances, at least 80% of its net assets (plus any borrowings for investment purposes) in (i) securities of companies that derive at least 50% of their net revenue directly from the marijuana and hemp business or from providing services, products or technology to the marijuana and hemp business, and (ii) derivatives that have economic characteristics similar to such securities. The fund is non-diversified.
Tue, 02 Apr 2024
Firm Adds Its 3rd Marijuana ETF - AOL
Tue, 22 Aug 2023
Breaking: Unwinding Poseidon Cannabis ETF, Managing Partner Drops Exclusive Insights - Markets Insider
Thu, 17 Aug 2023
Marijuana ETF Folds Amid Uncertainty About Legal Weed - Yahoo Finance
Tue, 15 Aug 2023
Poseidon Dynamic Cannabis ETF to close as investors lose interest in marijuana industry - CNBC
Mon, 14 Aug 2023
Poseidon cannabis ETF to shut down less than 2 years after launching - Marijuana Business Daily
Tue, 11 Jul 2023
Top Performing Leveraged/Inverse ETFs: 07/09/2023 - ETF Trends
| Price to Book Value: P/BV, a ratio used to compare book value to its current market price, to gauge whether a stock is valued properly. |
Neutral |
| Price to Earnings: PE, the ratio for valuing a company that measures its current share price relative to its earnings per share (EPS). |
Neutral |
| Discounted cash flow: DCF, a valuation method used to estimate the value of an investment based on its expected future cash flows. |
Neutral |
| Return on Assets: ROA, indicates how profitable a company is in relation to its total assets, how efficiently uses assets to generate a profit. |
Neutral |
| Return on Equity: ROE, a measure of financial performance calculated by dividing net income by equity. a gauge of profitability and efficiency. |
Neutral |
| Debt to Equity: evaluate financial leverage, reflects the ability of equity to cover outstanding debts in the event of a business downturn. |
Neutral |
|
Exchange:
AMEX
|
|
|
Sector:
|
|
|
Industry:
|
|
| Shares Out | 0 (M) |
| Shares Float | 0 (M) |
| Held by Insiders | 0 (%) |
| Held by Institutions | 0 (%) |
| Shares Short | 0 (K) |
| Shares Short P.Month | 0 (K) |
| EPS | 0 |
| EPS Est Next Qtrly | 0 |
| EPS Est This Year | 0 |
| EPS Est Next Year | 0 |
| Book Value (p.s.) | 0 |
| Profit Margin | 0 % |
| Operating Margin | 0 % |
| Return on Assets (ttm) | 0 % |
| Return on Equity (ttm) | 0 % |
| Qtrly Rev. Growth | 0 % |
| Gross Profit (p.s.) | 0 |
| Sales Per Share | 0 |
| EBITDA (p.s.) | 0 |
| Qtrly Earnings Growth | 0 % |
| Operating Cash Flow | 0 (M) |
| Levered Free Cash Flow | 0 (M) |
| PE Ratio | 0 |
| PEG Ratio | 0 |
| Price to Book value | 0 |
| Price to Sales | 0 |
| Price to Cash Flow | 0 |
| Dividend | 0 |
| Forward Dividend | 0 |
| Dividend Yield | 0% |
| Dividend Pay Date | Invalid DateTime. |
| Ex-Dividend Date | Invalid DateTime. |

|

|
|

|
|
|
|
|
|