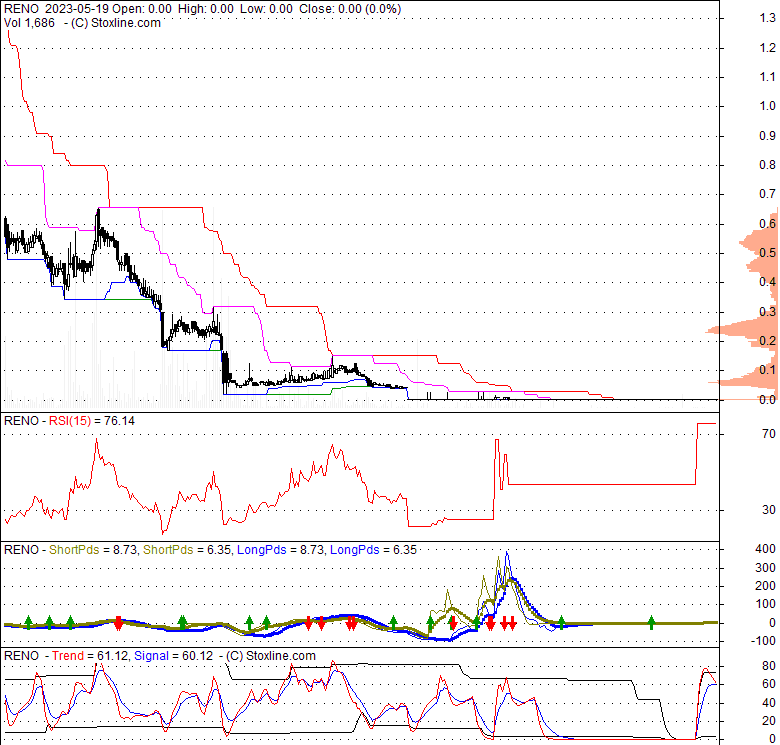
| 1.0E-6 0 (0%) | 04-08 12:26 | |||||||||||||
|
|
| Short term | |
|||
| Mid term | |
|||
| Targets | 6-month : | 0 | 1-year : | 0 |
| Resists | First : | 0 | Second : | 0 |
| Pivot price | 0 |
|||
| Supports | First : | 0 | Second : | 0 |
| MAs | MA(5) : | 0 | MA(20) : | 0 |
| MA(100) : | 0 |
MA(250) : | 0.04 |
|
| MACD | MACD : | 0 |
Signal : | 0 |
| %K %D | K(14,3) : | 49.9 | D(3) : | 49.9 |
| RSI | RSI(14): 82.7 | |||
| 52-week | High : | 0.31 | Low : | 0 |
Price has closed below its short-term moving average. Short-term moving average is currently above mid-term; and below long-term moving average. From the relationship between price and moving averages: This stock is NEUTRAL in short-term; and NEUTRAL in mid-long term.[ RENO ] has closed below upper band by 32.3%. Bollinger Bands are 91.5% narrower than normal. The narrow width of the bands suggests low volatility as compared to its normal range. The bands have been in this narrow range for 132 bars. This is a sign that the market may be about to initiate a new trend.
| If tomorrow: | Open lower | Open higher |
| High: | 0 - 0 | 0 - 0 |
| Low: | 0 - 0 | 0 - 0 |
| Close: | 0 - 0 | 0 - 0 |
Renovare Environmental, Inc., through its subsidiaries, provides environmental management solutions worldwide. The company's suite of technologies includes on-site biological processing equipment for food waste, patented processing facilities for the conversion of municipal solid waste into renewable fuel, and proprietary real-time data analytics tools to reduce food waste generation. It markets Revolution Series Digesters, an aerobic digestion technology solution for the disposal of food waste at the point of generation; and Mechanical Biological Treatment technology to process waste at the municipal or enterprise level. The company serves retail, healthcare, government, hospitality, education, food service, and other sectors, as well as food distributors, convention centers, hotels, restaurants, stadiums, municipalities, and academic institutions. The company was formerly known as BioHiTech Global, Inc. and changed its name to Renovare Environmental, Inc. in December 2021. Renovare Environmental, Inc. is headquartered in Chestnut Ridge, New York.
Sat, 09 Dec 2023
BioHiTech Global Rebrands to Renovare Environmental Inc. - waste360
Fri, 24 Jun 2022
Renovare Environmental Announces Intention to Merge with Harp Renewables and Harp Electric Engineering - PR Newswire
Thu, 03 Mar 2022
Renovare Environmental to Acquire Harp Renewables - PR Newswire
Tue, 28 Dec 2021
Renovare Environmental (RENO) Stock Price, News & Analysis - MarketBeat
Mon, 13 Dec 2021
BIOHITECH GLOBAL REBRANDS TO RENOVARE ENVIRONMENTAL, INC. - PR Newswire
| Price to Book Value: P/BV, a ratio used to compare book value to its current market price, to gauge whether a stock is valued properly. |
Underperform |
| Price to Earnings: PE, the ratio for valuing a company that measures its current share price relative to its earnings per share (EPS). |
Underperform |
| Discounted cash flow: DCF, a valuation method used to estimate the value of an investment based on its expected future cash flows. |
Neutral |
| Return on Assets: ROA, indicates how profitable a company is in relation to its total assets, how efficiently uses assets to generate a profit. |
Underperform |
| Return on Equity: ROE, a measure of financial performance calculated by dividing net income by equity. a gauge of profitability and efficiency. |
Underperform |
| Debt to Equity: evaluate financial leverage, reflects the ability of equity to cover outstanding debts in the event of a business downturn. |
Underperform |

|
Exchange:
PNK
|
|
|
Sector:
Industrials
|
|
|
Industry:
Industrial - Pollution & Treatment Controls
|
|
| Shares Out | 35 (M) |
| Shares Float | 33 (M) |
| Held by Insiders | 10.1 (%) |
| Held by Institutions | 0 (%) |
| Shares Short | 472 (K) |
| Shares Short P.Month | 474 (K) |
| EPS | -0.93 |
| EPS Est Next Qtrly | 0 |
| EPS Est This Year | 0 |
| EPS Est Next Year | 0 |
| Book Value (p.s.) | -0.52 |
| Profit Margin | -223.5 % |
| Operating Margin | -74.8 % |
| Return on Assets (ttm) | -9.7 % |
| Return on Equity (ttm) | 0 % |
| Qtrly Rev. Growth | -62.6 % |
| Gross Profit (p.s.) | 0.05 |
| Sales Per Share | 0.29 |
| EBITDA (p.s.) | -0.17 |
| Qtrly Earnings Growth | 0 % |
| Operating Cash Flow | -7 (M) |
| Levered Free Cash Flow | -4 (M) |
| PE Ratio | -0.01 |
| PEG Ratio | 0 |
| Price to Book value | -0.01 |
| Price to Sales | 0 |
| Price to Cash Flow | -0.01 |
| Dividend | 0 |
| Forward Dividend | 0 |
| Dividend Yield | 0% |
| Dividend Pay Date | Invalid DateTime. |
| Ex-Dividend Date | Invalid DateTime. |