| 10.16 0.01 (0.1%) | 12-31 19:00 | |||||||||||||
|
|
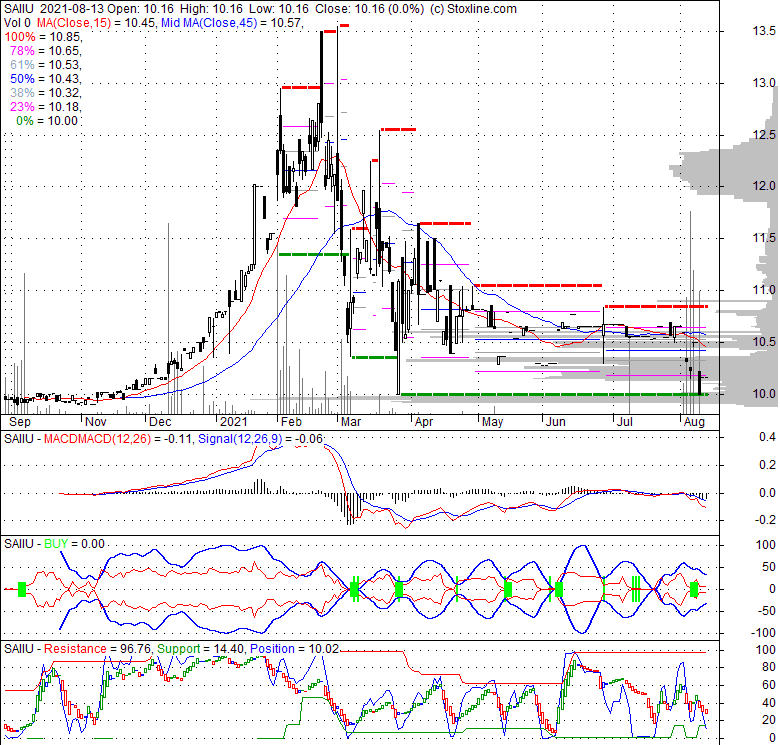
| Short term | |
|||
| Mid term | |
|||
| Targets | 6-month : | 1-year : | ||
| Resists | First : | Second : | ||
| Pivot price | ||||
| Supports | First : | Second : | ||
| MAs | MA(5) : | MA(20) : | ||
| MA(100) : | MA(250) : | |||
| MACD | MACD : | Signal : | ||
| %K %D | K(14,3) : | D(3) : | ||
| RSI | RSI(14): | |||
| 52-week | High : | Low : | ||
| If tomorrow: | Open lower | Open higher |
| High: | - | - |
| Low: | - | - |
| Close: | - | - |
Software Acquisition Group Inc. II intends to effect a merger, capital stock exchange, asset acquisition, stock purchase, reorganization, or similar business combination with one or more businesses in software companies. The company was founded in 2020 and is based in Las Vegas, Nevada.
Fri, 18 Sep 2020
Nasdaq Welcomes 14 IPOs in 5 Days as IPO Activity Surges This September - Nasdaq
Fri, 21 Aug 2020
Software Acquisition Group II Files for IPO - The Wall Street Journal
| Price to Book Value: P/BV, a ratio used to compare book value to its current market price, to gauge whether a stock is valued properly. |
Neutral |
| Price to Earnings: PE, the ratio for valuing a company that measures its current share price relative to its earnings per share (EPS). |
Neutral |
| Discounted cash flow: DCF, a valuation method used to estimate the value of an investment based on its expected future cash flows. |
Neutral |
| Return on Assets: ROA, indicates how profitable a company is in relation to its total assets, how efficiently uses assets to generate a profit. |
Neutral |
| Return on Equity: ROE, a measure of financial performance calculated by dividing net income by equity. a gauge of profitability and efficiency. |
Neutral |
| Debt to Equity: evaluate financial leverage, reflects the ability of equity to cover outstanding debts in the event of a business downturn. |
Neutral |
|
Exchange:
NASDAQ
|
|
|
Sector:
Financial Services
|
|
|
Industry:
Shell Companies
|
|
| Shares Out | 0 (M) |
| Shares Float | 0 (M) |
| Held by Insiders | (%) |
| Held by Institutions | (%) |
| Shares Short | 0 (K) |
| Shares Short P.Month | 0 (K) |
| EPS | |
| EPS Est Next Qtrly | |
| EPS Est This Year | |
| EPS Est Next Year | |
| Book Value (p.s.) | |
| Profit Margin | % |
| Operating Margin | % |
| Return on Assets (ttm) | % |
| Return on Equity (ttm) | % |
| Qtrly Rev. Growth | % |
| Gross Profit (p.s.) | |
| Sales Per Share | |
| EBITDA (p.s.) | |
| Qtrly Earnings Growth | % |
| Operating Cash Flow | 0 (M) |
| Levered Free Cash Flow | 0 (M) |
| PE Ratio | |
| PEG Ratio | |
| Price to Book value | |
| Price to Sales | |
| Price to Cash Flow |
| Dividend | |
| Forward Dividend | |
| Dividend Yield | 0% |
| Dividend Pay Date | |
| Ex-Dividend Date |

|

|
|

|
|
|
|
|
|