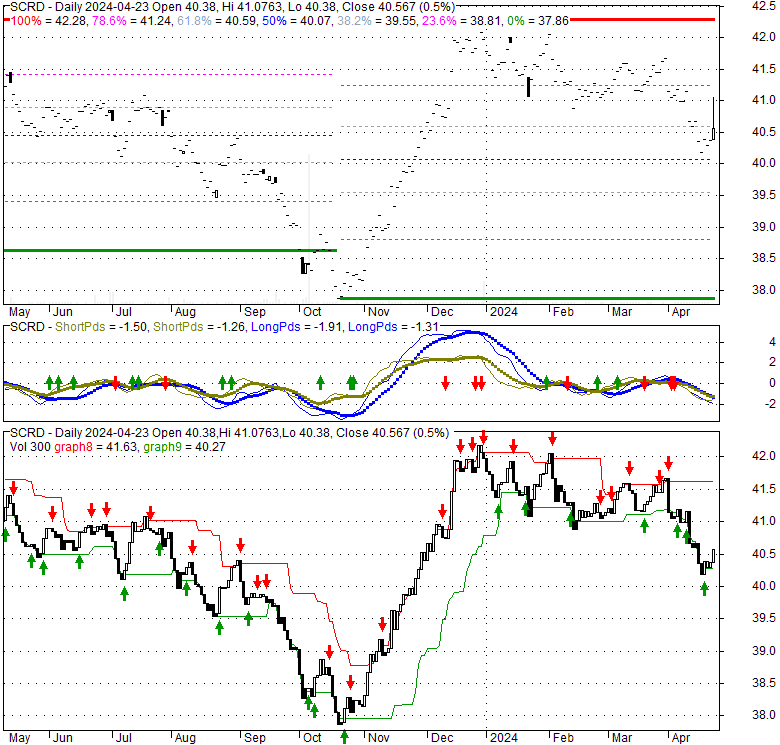
| 40.38 -0.066 (-0.16%) | 04-23 09:30 | |||||||||||||
|
|
| Short term | ||||
| Mid term | |
|||
| Targets | 6-month : | 47.99 | 1-year : | 48.66 |
| Resists | First : | 41.09 | Second : | 41.66 |
| Pivot price | 40.68 |
|||
| Supports | First : | 40.17 | Second : | 33.42 |
| MAs | MA(5) : | 40.32 |
MA(20) : | 40.88 |
| MA(100) : | 41.27 |
MA(250) : | 40.52 |
|
| MACD | MACD : | -0.3 |
Signal : | -0.3 |
| %K %D | K(14,3) : | 15.7 |
D(3) : | 12.2 |
| RSI | RSI(14): 36.5 |
|||
| 52-week | High : | 42.17 | Low : | 37.86 |
Price has closed above its short-term moving average. Short-term moving average is currently below mid-term; and below long-term moving average. From the relationship between price and moving averages: This stock is NEUTRAL in short-term; and BEARISH in mid-long term.[ SCRD ] has closed above bottom band by 27.5%. Bollinger Bands are 22.3% wider than normal. The current width of the bands does not suggest anything about the future direction or movement of prices.
| If tomorrow: | Open lower | Open higher |
| High: | 40.41 - 40.69 | 40.69 - 40.91 |
| Low: | 39.83 - 40.14 | 40.14 - 40.38 |
| Close: | 39.98 - 40.45 | 40.45 - 40.81 |
The fund invests at least 80% of its net assets (plus any borrowings for investment purposes) in U.S. dollar denominated corporate bonds and commercial paper of various maturities. The fund will invest principally in investment grade bonds. The fund will generally sell or dispose of portfolio investments when, in the opinion of the adviser, they no longer present attractive investment opportunity and/or no longer meet the fund’s ESG and/or sustainable criteria.
Sun, 31 Mar 2024
Janus Henderson Sustainable Corporate Bond ETF (SCRD) To Go Ex-Dividend on April 1st - Defense World
Tue, 12 Mar 2024
Janus Henderson plans to reposition sustainable corporate bond ETF (NYSEARCA:SCRD) - Seeking Alpha
Tue, 12 Mar 2024
Janus Henderson looks to ditch ESG label on bond ETF - Citywire Professional Buyer
Tue, 12 Mar 2024
Janus Henderson Investors Announces Changes to ETF Line-Up - Yahoo Finance
Fri, 10 Sep 2021
Janus Henderson Launches Suite of Sustainable ETFs - ESG Today
| Price to Book Value: P/BV, a ratio used to compare book value to its current market price, to gauge whether a stock is valued properly. |
Neutral |
| Price to Earnings: PE, the ratio for valuing a company that measures its current share price relative to its earnings per share (EPS). |
Neutral |
| Discounted cash flow: DCF, a valuation method used to estimate the value of an investment based on its expected future cash flows. |
Neutral |
| Return on Assets: ROA, indicates how profitable a company is in relation to its total assets, how efficiently uses assets to generate a profit. |
Neutral |
| Return on Equity: ROE, a measure of financial performance calculated by dividing net income by equity. a gauge of profitability and efficiency. |
Neutral |
| Debt to Equity: evaluate financial leverage, reflects the ability of equity to cover outstanding debts in the event of a business downturn. |
Neutral |
|
Exchange:
AMEX
|
|
|
Sector:
Financial Services
|
|
|
Industry:
Asset Management
|
|
| Shares Out | 0 (M) |
| Shares Float | 0 (M) |
| Held by Insiders | 0 (%) |
| Held by Institutions | 0 (%) |
| Shares Short | 0 (K) |
| Shares Short P.Month | 0 (K) |
| EPS | 0 |
| EPS Est Next Qtrly | 0 |
| EPS Est This Year | 0 |
| EPS Est Next Year | 0 |
| Book Value (p.s.) | 0 |
| Profit Margin | 0 % |
| Operating Margin | 0 % |
| Return on Assets (ttm) | 0 % |
| Return on Equity (ttm) | 0 % |
| Qtrly Rev. Growth | 0 % |
| Gross Profit (p.s.) | 0 |
| Sales Per Share | 0 |
| EBITDA (p.s.) | 0 |
| Qtrly Earnings Growth | 0 % |
| Operating Cash Flow | 0 (M) |
| Levered Free Cash Flow | 0 (M) |
| PE Ratio | 0 |
| PEG Ratio | 0 |
| Price to Book value | 0 |
| Price to Sales | 0 |
| Price to Cash Flow | 0 |
| Dividend | 0 |
| Forward Dividend | 0 |
| Dividend Yield | 0% |
| Dividend Pay Date | Invalid DateTime. |
| Ex-Dividend Date | Invalid DateTime. |

|

|
|

|
|
|
|
|
|