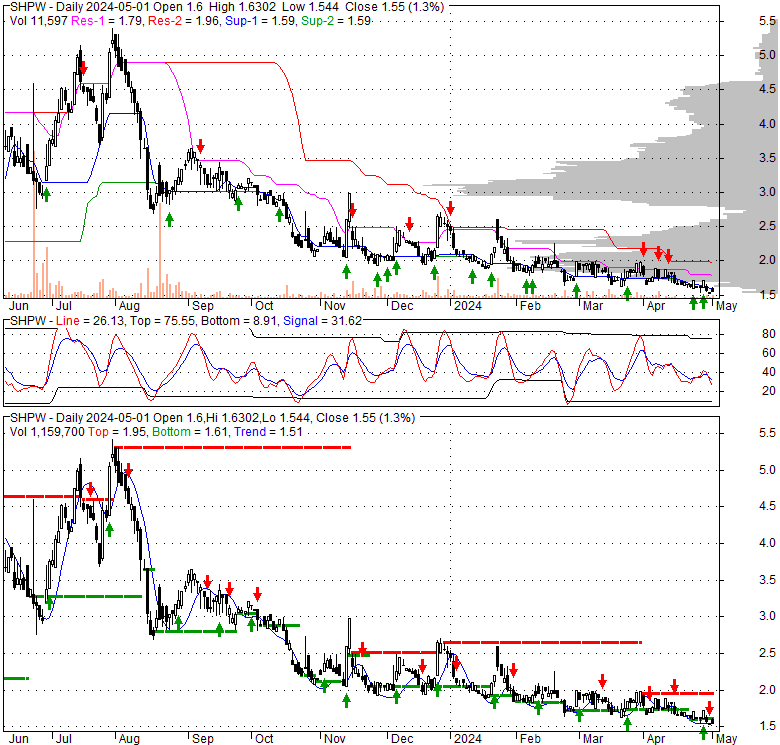
| 1.69 0.04 (2.42%) | 04-18 16:00 | |||||||||||||
|
|
| Short term | ||||
| Mid term | |
|||
| Targets | 6-month : | 2.16 |
1-year : | 2.33 |
| Resists | First : | 1.85 |
Second : | 2 |
| Pivot price | 1.76 |
|||
| Supports | First : | 1.62 |
Second : | 1.34 |
| MAs | MA(5) : | 1.7 |
MA(20) : | 1.78 |
| MA(100) : | 1.98 |
MA(250) : | 2.76 |
|
| MACD | MACD : | -0.1 |
Signal : | -0.1 |
| %K %D | K(14,3) : | 8 |
D(3) : | 10.8 |
| RSI | RSI(14): 44.8 |
|||
| 52-week | High : | 5.53 | Low : | 1.62 |
Price has closed below its short-term moving average. Short-term moving average is currently below mid-term; and below long-term moving average. From the relationship between price and moving averages: This stock is BEARISH in short-term; and BEARISH in mid-long term.[ SHPW ] has closed above bottom band by 29.4%. Bollinger Bands are 32.9% narrower than normal. The current width of the bands does not suggest anything about the future direction or movement of prices.
| If tomorrow: | Open lower | Open higher |
| High: | 1.69 - 1.7 | 1.7 - 1.71 |
| Low: | 1.6 - 1.61 | 1.61 - 1.62 |
| Close: | 1.67 - 1.69 | 1.69 - 1.71 |
Shapeways Holdings, Inc. facilitates the design, manufacture, and sale of 3D printed products in the United States, Europe, and internationally. The company offers an end-to-end digital manufacturing platform on which the users can transform digital designs into physical products under the Otto brand. It provides additive manufacturing services, such as 3D printing, rapid prototyping, and design services; and traditional manufacturing services, including injection molding, sheet metal, urethane and vacuum casting, CNC machining, and machine tooling. It also offers selective laser sintering materials, which include nylon 12, thermoplastic polyurethane, nylon 11, nylon 6 mineral filled, and polypropylene; binder jetting materials consisting of stainless steel and sandstone; multi-jet fusion materials; stereolithography materials, such as accura 60, accura xtreme, and accura xtreme white 200; selective laser melting material, including aluminum; material jetting materials, such as fine detail plastic, multi-color polyjet, and high definition full color; and wax casting materials comprising copper, platinum, gold, silver, bronze, brass, rhodium plated brass, and gold plated brass. The company serves the medical, consumer, robotics, architecture, aerospace, gaming, drones, education, and jewelry industries. Shapeways Holdings, Inc. was founded in 2008 and is based in Long Island City, New York.
Fri, 05 Apr 2024
Needham cuts Shapeways stock price target on scale concerns - Investing.com South Africa
Thu, 28 Mar 2024
Shapeways Holdings, Inc. (SHPW) Q4 2023 Earnings Call Transcript - Seeking Alpha
Wed, 27 Mar 2024
Earnings Outlook For Shapeways Hldgs - Shapeways Holdings (NASDAQ:SHPW) - Benzinga
Thu, 21 Mar 2024
Shapeways to Report Fourth Quarter 2023 Financial Results - Business Wire
Tue, 23 Jan 2024
Shapeways doubles auto business with new contracts By Investing.com - Investing.com
Wed, 15 Nov 2023
Shapeways Holdings, Inc. (NYSE:SHPW) Q3 2023 Earnings Call Transcript - Yahoo Finance
| Price to Book Value: P/BV, a ratio used to compare book value to its current market price, to gauge whether a stock is valued properly. |
Outperform |
| Price to Earnings: PE, the ratio for valuing a company that measures its current share price relative to its earnings per share (EPS). |
Underperform |
| Discounted cash flow: DCF, a valuation method used to estimate the value of an investment based on its expected future cash flows. |
Underperform |
| Return on Assets: ROA, indicates how profitable a company is in relation to its total assets, how efficiently uses assets to generate a profit. |
Underperform |
| Return on Equity: ROE, a measure of financial performance calculated by dividing net income by equity. a gauge of profitability and efficiency. |
Underperform |
| Debt to Equity: evaluate financial leverage, reflects the ability of equity to cover outstanding debts in the event of a business downturn. |
Underperform |

|
Exchange:
NYSE
|
|
|
Sector:
Industrials
|
|
|
Industry:
Industrial - Machinery
|
|
| Shares Out | 7 (M) |
| Shares Float | 3 (M) |
| Held by Insiders | 8.8 (%) |
| Held by Institutions | 53.1 (%) |
| Shares Short | 17 (K) |
| Shares Short P.Month | 33 (K) |
| EPS | -6.52 |
| EPS Est Next Qtrly | 0 |
| EPS Est This Year | 0 |
| EPS Est Next Year | 0 |
| Book Value (p.s.) | 4.07 |
| Profit Margin | -127.5 % |
| Operating Margin | -72.7 % |
| Return on Assets (ttm) | -33 % |
| Return on Equity (ttm) | -92.9 % |
| Qtrly Rev. Growth | 8.6 % |
| Gross Profit (p.s.) | 0 |
| Sales Per Share | 5.2 |
| EBITDA (p.s.) | -4.44 |
| Qtrly Earnings Growth | 0 % |
| Operating Cash Flow | -27 (M) |
| Levered Free Cash Flow | -21 (M) |
| PE Ratio | -0.26 |
| PEG Ratio | 0 |
| Price to Book value | 0.41 |
| Price to Sales | 0.32 |
| Price to Cash Flow | -0.42 |
| Dividend | 0 |
| Forward Dividend | 0 |
| Dividend Yield | 0% |
| Dividend Pay Date | Invalid DateTime. |
| Ex-Dividend Date | Invalid DateTime. |