| 25.33 0.03 (0.12%) | 05-25 15:59 | |||||||||||||
|
|
| Short term | |
|||
| Mid term | |
|||
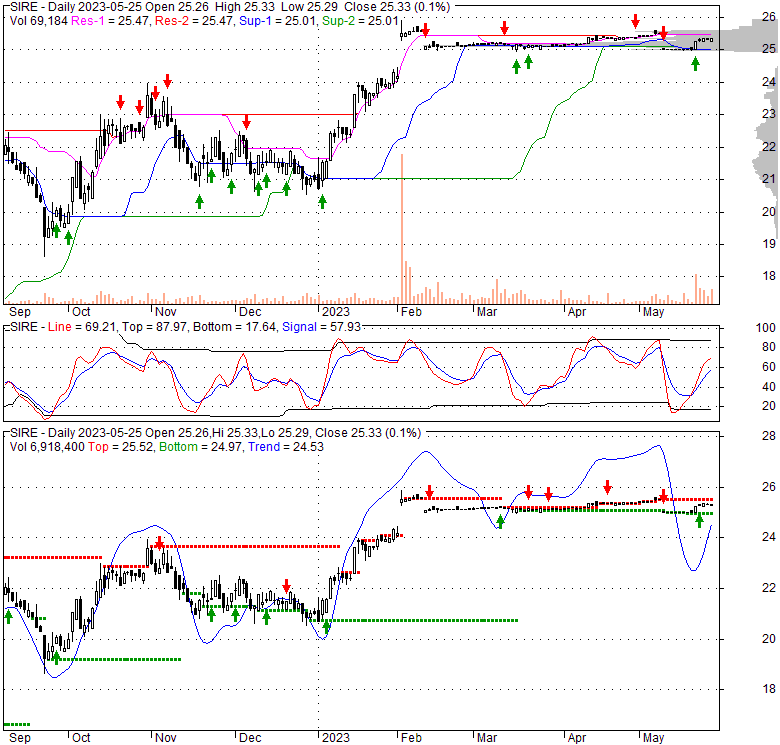
| Targets | 6-month : | 29.9 | 1-year : | 34.92 |
| Resists | First : | 25.6 | Second : | 29.9 |
| Pivot price | 25.16 |
|||
| Supports | First : | 25.19 | Second : | 24.94 |
| MAs | MA(5) : | 25.3 |
MA(20) : | 25.23 |
| MA(100) : | 24.77 |
MA(250) : | 22.32 |
|
| MACD | MACD : | 0 |
Signal : | -0.1 |
| %K %D | K(14,3) : | 58 |
D(3) : | 56 |
| RSI | RSI(14): 58.2 |
|||
| 52-week | High : | 25.92 | Low : | 16.5 |
Price has closed above its short-term moving average. Short-term moving average is currently above mid-term; and above long-term moving average. From the relationship between price and moving averages: This stock is BULLISH in short-term; and BULLISH in mid-long term.[ SIRE ] has closed below upper band by 28.6%. Bollinger Bands are 35.3% narrower than normal. The current width of the bands does not suggest anything about the future direction or movement of prices.
| If tomorrow: | Open lower | Open higher |
| High: | 25.36 - 25.46 | 25.46 - 25.55 |
| Low: | 25.01 - 25.13 | 25.13 - 25.24 |
| Close: | 25.11 - 25.32 | 25.32 - 25.49 |
Sisecam Resources LP, together with its subsidiaries, engages in the trona ore mining and soda ash production businesses in the United States and internationally. It processes trona ore into soda ash, which is a raw material in flat glass, container glass, detergents, chemicals, paper, and other consumer and industrial products. The company holds approximately 23,500 acres of leased and licensed subsurface mining areas in the Green River Basin of Wyoming. As of December 31, 2021, it had proven and probable reserves of approximately 220.0 million short tons of trona. The company was formerly known as Ciner Resources LP and changed its name to Sisecam Resources LP in February 2022. Sisecam Resources LP was incorporated in 2013 and is headquartered in Atlanta, Georgia.
Fri, 10 Feb 2023
PFE: 2 Dividend Stocks to Buy in 2023 for a Stable Income Stream - StockNews.com
Sat, 17 Dec 2022
Sisecam Resources Stock: Focusing On Reducing Risk (NYSE:SIRE) - Seeking Alpha
Mon, 21 Nov 2022
SIRE: If You Want Passive Income, You Will Love This Stock - StockNews.com
Mon, 29 Aug 2022
NVO: 5 “Strong Buy” Stocks to Buy This Week - StockNews.com
Wed, 06 Jul 2022
Sisecam Chemicals Resources LLC Delivers Proposal to Acquire Sisecam Resources LP - Business Wire
Thu, 17 Feb 2022
Ciner Resources LP Announces Name Change to Sisecam Resources LP - Business Wire
| Price to Book Value: P/BV, a ratio used to compare book value to its current market price, to gauge whether a stock is valued properly. |
Neutral |
| Price to Earnings: PE, the ratio for valuing a company that measures its current share price relative to its earnings per share (EPS). |
Outperform |
| Discounted cash flow: DCF, a valuation method used to estimate the value of an investment based on its expected future cash flows. |
Underperform |
| Return on Assets: ROA, indicates how profitable a company is in relation to its total assets, how efficiently uses assets to generate a profit. |
Outperform |
| Return on Equity: ROE, a measure of financial performance calculated by dividing net income by equity. a gauge of profitability and efficiency. |
Outperform |
| Debt to Equity: evaluate financial leverage, reflects the ability of equity to cover outstanding debts in the event of a business downturn. |
Outperform |
|
Exchange:
NYSE
|
|
|
Sector:
Basic Materials
|
|
|
Industry:
Chemicals
|
|
| Shares Out | 20 (M) |
| Shares Float | 5 (M) |
| Held by Insiders | 74.2 (%) |
| Held by Institutions | 6.1 (%) |
| Shares Short | 36 (K) |
| Shares Short P.Month | 51 (K) |
| EPS | 3.33 |
| EPS Est Next Qtrly | 0 |
| EPS Est This Year | 0 |
| EPS Est Next Year | 0 |
| Book Value (p.s.) | 10.65 |
| Profit Margin | 8.8 % |
| Operating Margin | 18.7 % |
| Return on Assets (ttm) | 14.8 % |
| Return on Equity (ttm) | 36.3 % |
| Qtrly Rev. Growth | 26.7 % |
| Gross Profit (p.s.) | 9.58 |
| Sales Per Share | 38.57 |
| EBITDA (p.s.) | 8.67 |
| Qtrly Earnings Growth | 26.7 % |
| Operating Cash Flow | 150 (M) |
| Levered Free Cash Flow | 76 (M) |
| PE Ratio | 7.58 |
| PEG Ratio | 0 |
| Price to Book value | 2.37 |
| Price to Sales | 0.65 |
| Price to Cash Flow | 3.34 |
| Dividend | 0 |
| Forward Dividend | 0 |
| Dividend Yield | 0% |
| Dividend Pay Date | Invalid DateTime. |
| Ex-Dividend Date | Invalid DateTime. |

|

|
|

|
|
|
|
|
|