| 0 (0%) | 04-25 16:03 | |||||||||||||
|
|
| Short term | ||||
| Mid term | |
|||
| Targets | 6-month : | 22.71 | 1-year : | 23.43 |
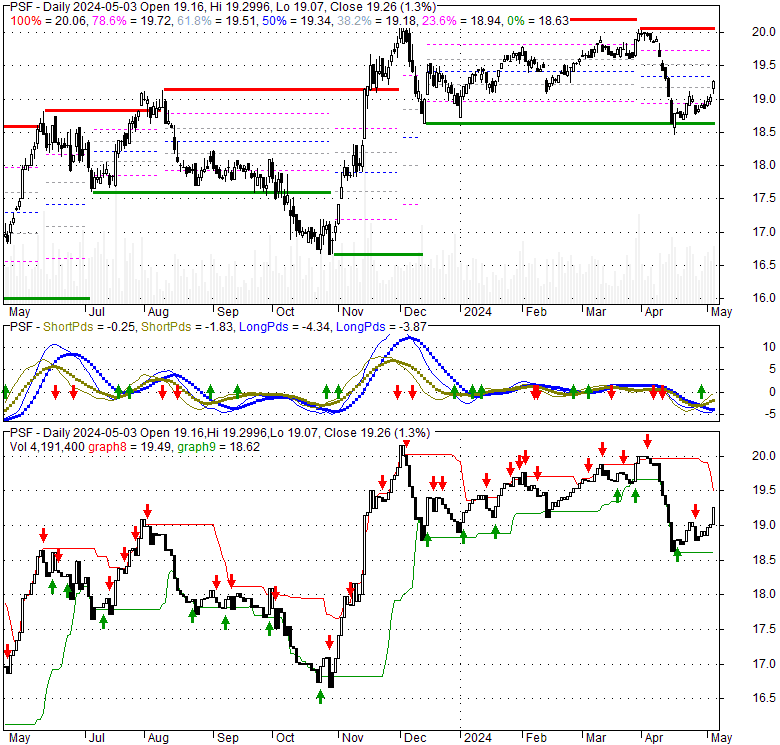
| Resists | First : | 19.44 | Second : | 20.05 |
| Pivot price | 19.1 |
|||
| Supports | First : | 18.45 | Second : | 15.35 |
| MAs | MA(5) : | 18.9 |
MA(20) : | 19.32 |
| MA(100) : | 19.43 |
MA(250) : | 18.52 |
|
| MACD | MACD : | -0.3 |
Signal : | -0.2 |
| %K %D | K(14,3) : | 32 |
D(3) : | 31.9 |
| RSI | RSI(14): 34.3 |
|||
| 52-week | High : | 20.19 | Low : | 16 |
Price has closed below its short-term moving average. Short-term moving average is currently below mid-term; and below long-term moving average. From the relationship between price and moving averages: This stock is BEARISH in short-term; and NEUTRAL in mid-long term.[ PSF ] has closed above bottom band by 30.9%. Bollinger Bands are 95% wider than normal. The large width of the bands suggest high volatility as compared to its normal range. The bands have been in this wide range for 8 days. This is a sign that the current trend might continue.
| If tomorrow: | Open lower | Open higher |
| High: | 19.08 - 19.18 | 19.18 - 19.25 |
| Low: | 18.7 - 18.8 | 18.8 - 18.88 |
| Close: | 18.83 - 19 | 19 - 19.13 |
Thu, 25 Apr 2024
How to Customize Your Skin Care Regime for Climate Change, According to Dermatologists - ELLE
Thu, 25 Apr 2024
Avoid All Sunscreen Brands, Except These 12 - 24/7 Wall St.
Thu, 25 Apr 2024
20 Daily Facial Moisturizers With SPF That Are Reviewer Favorites For A Reason - BuzzFeed
Thu, 25 Apr 2024
Do Powder Sunscreens Really Work? Here's What Experts Say - Real Simple
Thu, 25 Apr 2024
A growing number of beauty brands are pushing for VAT cuts on suncare products - Women's Health UK
Thu, 25 Apr 2024
Best sunscreen with SPF 50: Step out confidently with top 10 picks to protect against the sun - Hindustan Times
| Price to Book Value: P/BV, a ratio used to compare book value to its current market price, to gauge whether a stock is valued properly. |
Neutral |
| Price to Earnings: PE, the ratio for valuing a company that measures its current share price relative to its earnings per share (EPS). |
Neutral |
| Discounted cash flow: DCF, a valuation method used to estimate the value of an investment based on its expected future cash flows. |
Neutral |
| Return on Assets: ROA, indicates how profitable a company is in relation to its total assets, how efficiently uses assets to generate a profit. |
Neutral |
| Return on Equity: ROE, a measure of financial performance calculated by dividing net income by equity. a gauge of profitability and efficiency. |
Neutral |
| Debt to Equity: evaluate financial leverage, reflects the ability of equity to cover outstanding debts in the event of a business downturn. |
Neutral |
|
Exchange:
|
|
|
Sector:
|
|
|
Industry:
|
|
| Shares Out | 12 (M) |
| Shares Float | 0 (M) |
| Held by Insiders | 0 (%) |
| Held by Institutions | 13.7 (%) |
| Shares Short | 36 (K) |
| Shares Short P.Month | 16 (K) |
| EPS | -0.19 |
| EPS Est Next Qtrly | 0 |
| EPS Est This Year | 0 |
| EPS Est Next Year | 0 |
| Book Value (p.s.) | 0 |
| Profit Margin | 0 % |
| Operating Margin | 0 % |
| Return on Assets (ttm) | 0 % |
| Return on Equity (ttm) | 0 % |
| Qtrly Rev. Growth | 0 % |
| Gross Profit (p.s.) | 0 |
| Sales Per Share | 0 |
| EBITDA (p.s.) | 0 |
| Qtrly Earnings Growth | 0 % |
| Operating Cash Flow | 0 (M) |
| Levered Free Cash Flow | 0 (M) |
| PE Ratio | -104.45 |
| PEG Ratio | 0 |
| Price to Book value | 0 |
| Price to Sales | 0 |
| Price to Cash Flow | 0 |
| Dividend | 0 |
| Forward Dividend | 0 |
| Dividend Yield | 0% |
| Dividend Pay Date | Invalid DateTime. |
| Ex-Dividend Date | Invalid DateTime. |

|

|
|

|
|
|
|
|
|