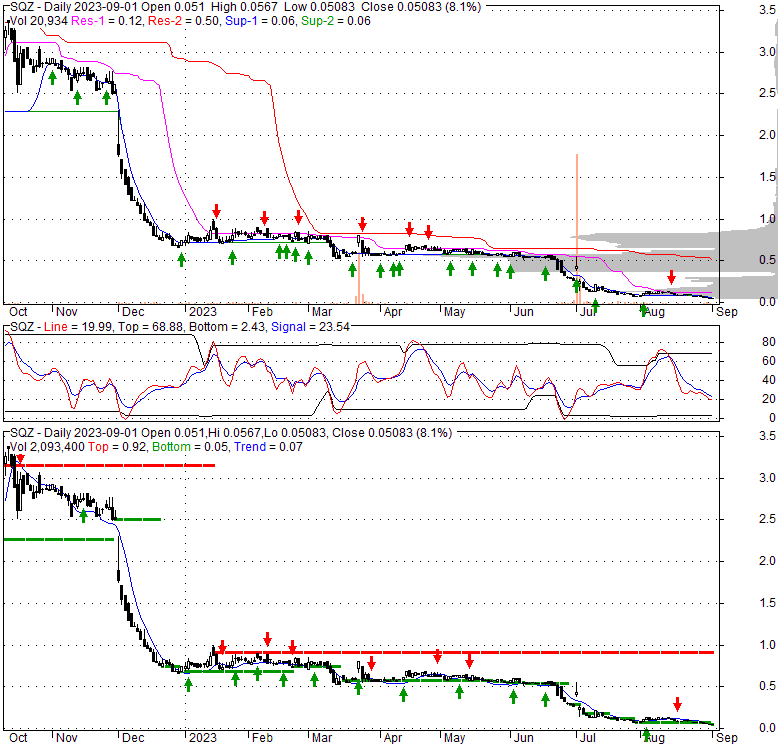
| 0.435 0.165 (61.11%) | 07-03 13:00 | |||||||||||||
|
|
| Short term | |
|||
| Mid term | |
|||
| Targets | 6-month : | 0.12 | 1-year : | 0.17 |
| Resists | First : | 0.1 | Second : | 0.14 |
| Pivot price | 0.08 |
|||
| Supports | First : | 0.04 | Second : | 0.03 |
| MAs | MA(5) : | 0.05 |
MA(20) : | 0.09 |
| MA(100) : | 0.37 |
MA(250) : | 1.09 |
|
| MACD | MACD : | -0.1 |
Signal : | -0.1 |
| %K %D | K(14,3) : | 3.9 |
D(3) : | 3.8 |
| RSI | RSI(14): 30.6 |
|||
| 52-week | High : | 3.38 | Low : | 0.04 |
Price has closed below its short-term moving average. Short-term moving average is currently below mid-term; and below long-term moving average. From the relationship between price and moving averages: This stock is BEARISH in short-term; and BEARISH in mid-long term.[ SQZ ] has closed above bottom band by 12.4%. Bollinger Bands are 42.9% narrower than normal. The narrow width of the bands suggests low volatility as compared to its normal range. The bands have been in this narrow range for 22 bars. This is a sign that the market may be about to initiate a new trend.
| If tomorrow: | Open lower | Open higher |
| High: | 0.06 - 0.06 | 0.06 - 0.06 |
| Low: | 0.05 - 0.05 | 0.05 - 0.05 |
| Close: | 0.05 - 0.05 | 0.05 - 0.05 |
SQZ Biotechnologies Company, a clinical-stage biotechnology company, develops cell therapies for patients with cancer, autoimmune, infectious diseases, and other serious conditions. Its lead product candidate is SQZ-PBMC-HPV, from its SQZ Antigen Presenting Cells platform, which is in a Phase I clinical trial as a monotherapy and in combination with other immuno-oncology agents for the treatment of HPV16+ advanced or metastatic solid tumors, including cervical, head-and-neck, anal, penile, vulvar, and vaginal cancer. The company also develops SQZ-AAC-HPV, which is in a Phase I clinical trial for the treatment of HPV16+ advanced or metastatic solid tumors in monotherapy and in combinations with other immune-oncology agents. Its additional platforms in development are SQZ Activating Antigen Carriers; and SQZ Tolerizing Antigen Carriers. SQZ Biotechnologies Company was incorporated in 2013 and is headquartered in Watertown, Massachusetts.
Tue, 26 Mar 2024
SQZ, Portal founder Armon Sharei on starting over in biotech - Yahoo Finance
Fri, 01 Mar 2024
Vancouver's Stemcell buys another American biotech, SQZ - Business in Vancouver
Fri, 01 Mar 2024
SQZ opts for liquidation, $11.8M asset fire sale to Stemcell - Fierce Biotech
Thu, 29 Feb 2024
STEMCELL Technologies Announces Successful Asset Purchase Agreement with SQZ Biotechnologies Company - Business Wire
Tue, 26 Dec 2023
Leerink Partners Serves as Exclusive Financial Advisor for SQZ Biotechnologies' Asset Sale to STEMCELL Technologies - SVB Leerink
Thu, 21 Dec 2023
SQZ founder Armon Sharei launches new cell therapy startup Portal Bio - Boston Business Journal - The Business Journals
| Price to Book Value: P/BV, a ratio used to compare book value to its current market price, to gauge whether a stock is valued properly. |
Underperform |
| Price to Earnings: PE, the ratio for valuing a company that measures its current share price relative to its earnings per share (EPS). |
Neutral |
| Discounted cash flow: DCF, a valuation method used to estimate the value of an investment based on its expected future cash flows. |
Neutral |
| Return on Assets: ROA, indicates how profitable a company is in relation to its total assets, how efficiently uses assets to generate a profit. |
Underperform |
| Return on Equity: ROE, a measure of financial performance calculated by dividing net income by equity. a gauge of profitability and efficiency. |
Underperform |
| Debt to Equity: evaluate financial leverage, reflects the ability of equity to cover outstanding debts in the event of a business downturn. |
Outperform |

|
Exchange:
NYSE
|
|
|
Sector:
Healthcare
|
|
|
Industry:
Biotechnology
|
|
| Shares Out | 0 (M) |
| Shares Float | 0 (M) |
| Held by Insiders | 0 (%) |
| Held by Institutions | 0 (%) |
| Shares Short | 0 (K) |
| Shares Short P.Month | 0 (K) |
| EPS | 0 |
| EPS Est Next Qtrly | 0 |
| EPS Est This Year | 0 |
| EPS Est Next Year | 0 |
| Book Value (p.s.) | 0 |
| Profit Margin | 0 % |
| Operating Margin | 0 % |
| Return on Assets (ttm) | 0 % |
| Return on Equity (ttm) | 0 % |
| Qtrly Rev. Growth | 0 % |
| Gross Profit (p.s.) | 0 |
| Sales Per Share | 0.63 |
| EBITDA (p.s.) | -2.43 |
| Qtrly Earnings Growth | 0 % |
| Operating Cash Flow | 0 (M) |
| Levered Free Cash Flow | 0 (M) |
| PE Ratio | 0 |
| PEG Ratio | 0 |
| Price to Book value | 0 |
| Price to Sales | 0.08 |
| Price to Cash Flow | 0 |
| Dividend | 0 |
| Forward Dividend | 0 |
| Dividend Yield | 0% |
| Dividend Pay Date | Invalid DateTime. |
| Ex-Dividend Date | Invalid DateTime. |