| 0 (0%) | 06-28 18:07 | |||||||||||||
|
|
| Short term | ||||
| Mid term | |
|||
| Targets | 6-month : | 59.49 |
1-year : | 64.84 |
| Resists | First : | 50.93 |
Second : | 55.52 |
| Pivot price | 49.33 |
|||
| Supports | First : | 43.52 | Second : | 36.2 |
| MAs | MA(5) : | 45.9 |
MA(20) : | 50.17 |
| MA(100) : | 55.59 |
MA(250) : | 60.82 |
|
| MACD | MACD : | -2.3 |
Signal : | -1.7 |
| %K %D | K(14,3) : | 10.5 |
D(3) : | 9.1 |
| RSI | RSI(14): 35 |
|||
| 52-week | High : | 90.8 | Low : | 38.29 |
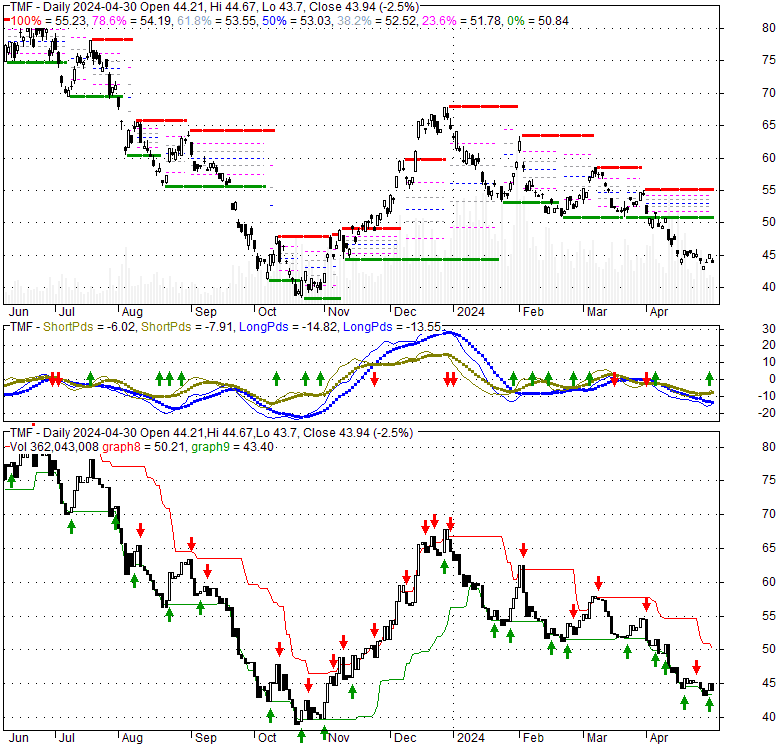
Price has closed below its short-term moving average. Short-term moving average is currently below mid-term; and below long-term moving average. From the relationship between price and moving averages: This stock is BEARISH in short-term; and BEARISH in mid-long term.[ TMF ] has closed above bottom band by 20.5%. Bollinger Bands are 20.2% wider than normal. The current width of the bands does not suggest anything about the future direction or movement of prices.
| If tomorrow: | Open lower | Open higher |
| High: | 44.79 - 45.04 | 45.04 - 45.32 |
| Low: | 42.81 - 43.09 | 43.09 - 43.4 |
| Close: | 43.79 - 44.29 | 44.29 - 44.83 |
Fri, 15 Mar 2024
Robert Reich's Takedown of TFM's Staggering Stupidity -- Seriously, how Dumb is Drumpf? - Daily Kos
Thu, 14 Mar 2024
The Male Wardrobe - TFM - Total Frat Move
Wed, 13 Mar 2024
Bring Back Blogging - TFM - Total Frat Move
Thu, 22 Feb 2024
Larry June teams up with Monroe Flow for “TFM Music” - REVOLT
Tue, 30 Jan 2024
TFM Comm, Inc. celebrates new location, 75th anniversary - WIBW
Mon, 04 Dec 2023
SDSU TFM's 'THIN AIR' Initiative Empowers Teens to Address Mental Health - San Diego State University
| Price to Book Value: P/BV, a ratio used to compare book value to its current market price, to gauge whether a stock is valued properly. |
Neutral |
| Price to Earnings: PE, the ratio for valuing a company that measures its current share price relative to its earnings per share (EPS). |
Neutral |
| Discounted cash flow: DCF, a valuation method used to estimate the value of an investment based on its expected future cash flows. |
Neutral |
| Return on Assets: ROA, indicates how profitable a company is in relation to its total assets, how efficiently uses assets to generate a profit. |
Neutral |
| Return on Equity: ROE, a measure of financial performance calculated by dividing net income by equity. a gauge of profitability and efficiency. |
Neutral |
| Debt to Equity: evaluate financial leverage, reflects the ability of equity to cover outstanding debts in the event of a business downturn. |
Neutral |
|
Exchange:
|
|
|
Sector:
|
|
|
Industry:
|
|
| Shares Out | 0 (M) |
| Shares Float | 0 (M) |
| Held by Insiders | 0 (%) |
| Held by Institutions | 0 (%) |
| Shares Short | 0 (K) |
| Shares Short P.Month | 0 (K) |
| EPS | 0 |
| EPS Est Next Qtrly | 0 |
| EPS Est This Year | 0 |
| EPS Est Next Year | 0 |
| Book Value (p.s.) | 0 |
| Profit Margin | 0 % |
| Operating Margin | 0 % |
| Return on Assets (ttm) | 0 % |
| Return on Equity (ttm) | 0 % |
| Qtrly Rev. Growth | 0 % |
| Gross Profit (p.s.) | 0 |
| Sales Per Share | 0 |
| EBITDA (p.s.) | 0 |
| Qtrly Earnings Growth | 0 % |
| Operating Cash Flow | 0 (M) |
| Levered Free Cash Flow | 0 (M) |
| PE Ratio | 0 |
| PEG Ratio | 0 |
| Price to Book value | 0 |
| Price to Sales | 0 |
| Price to Cash Flow | 0 |
| Dividend | 0 |
| Forward Dividend | 0 |
| Dividend Yield | 0% |
| Dividend Pay Date | Invalid DateTime. |
| Ex-Dividend Date | Invalid DateTime. |

|

|
|

|
|
|
|
|
|