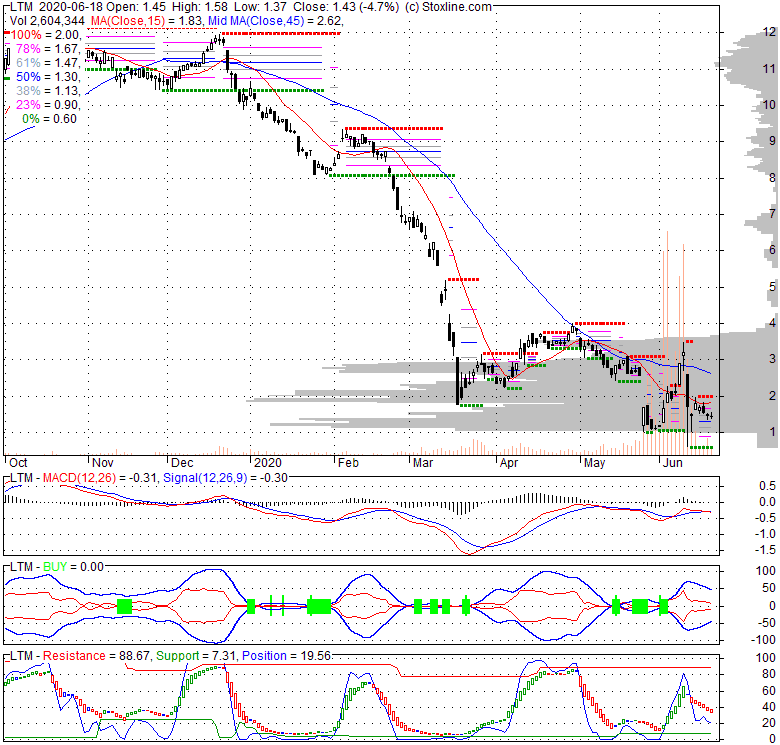
| 0 (0%) | 04-20 10:15 | |||||||||||||
|
|
| Short term | |
|||
| Mid term | |
|||
| Targets | 6-month : | 3.5 | 1-year : | 4.09 |
| Resists | First : | 3 | Second : | 3.5 |
| Pivot price | 3 | |||
| Supports | First : | 2.99 | Second : | 2.99 |
| MAs | MA(5) : | 3 | MA(20) : | 3 |
| MA(100) : | 3 | MA(250) : | 2.66 |
|
| MACD | MACD : | 0 |
Signal : | 0 |
| %K %D | K(14,3) : | 100 | D(3) : | 100 |
| RSI | RSI(14): 79.1 | |||
| 52-week | High : | 3 | Low : | 0.55 |
Price has closed below its short-term moving average. Short-term moving average is currently below mid-term; and below long-term moving average. From the relationship between price and moving averages: This stock is NEUTRAL in short-term; and NEUTRAL in mid-long term.[ TLMD ] has closed Bollinger Bands are 0% narrower than normal.
| If tomorrow: | Open lower | Open higher |
| High: | 3.01 - 3.02 | 3.02 - 3.03 |
| Low: | 2.95 - 2.97 | 2.97 - 2.99 |
| Close: | 2.97 - 3 | 3 - 3.03 |
Fri, 19 Apr 2024
Staking Alien Worlds $TLM: The Basics You Should Know - Medium
Tue, 16 Apr 2024
Archdiocese of Baltimore announces proposed restructuring plan, and that all TLM Masses will only celebrated by ... - CatholicVote org
Sun, 14 Apr 2024
TLM Audio shop now offers assembled ST Modular modules in Europe - Synth Anatomy
Fri, 01 Mar 2024
Buy Alien Worlds | Buy TLM in 4 steps (March 2024) - Securities.io
Thu, 29 Feb 2024
TLM crackdown continues: England’s Archbishop of Westminster says no Latin at Easter - The Catholic Thing
Mon, 26 Feb 2024
Is Alien Worlds (TLM) a Good Investment Monday? - InvestorsObserver
| Price to Book Value: P/BV, a ratio used to compare book value to its current market price, to gauge whether a stock is valued properly. |
Neutral |
| Price to Earnings: PE, the ratio for valuing a company that measures its current share price relative to its earnings per share (EPS). |
Neutral |
| Discounted cash flow: DCF, a valuation method used to estimate the value of an investment based on its expected future cash flows. |
Neutral |
| Return on Assets: ROA, indicates how profitable a company is in relation to its total assets, how efficiently uses assets to generate a profit. |
Neutral |
| Return on Equity: ROE, a measure of financial performance calculated by dividing net income by equity. a gauge of profitability and efficiency. |
Neutral |
| Debt to Equity: evaluate financial leverage, reflects the ability of equity to cover outstanding debts in the event of a business downturn. |
Neutral |
|
Exchange:
|
|
|
Sector:
|
|
|
Industry:
|
|
| Shares Out | 101 (M) |
| Shares Float | 48 (M) |
| Held by Insiders | 12.8 (%) |
| Held by Institutions | 73.2 (%) |
| Shares Short | 1,800 (K) |
| Shares Short P.Month | 1,830 (K) |
| EPS | -1.88 |
| EPS Est Next Qtrly | 0 |
| EPS Est This Year | 0 |
| EPS Est Next Year | 0 |
| Book Value (p.s.) | 1.79 |
| Profit Margin | -77.2 % |
| Operating Margin | -71.3 % |
| Return on Assets (ttm) | -22.3 % |
| Return on Equity (ttm) | -98.2 % |
| Qtrly Rev. Growth | 76.3 % |
| Gross Profit (p.s.) | 0.19 |
| Sales Per Share | 0.79 |
| EBITDA (p.s.) | -0.52 |
| Qtrly Earnings Growth | 0 % |
| Operating Cash Flow | -39 (M) |
| Levered Free Cash Flow | -10 (M) |
| PE Ratio | -1.6 |
| PEG Ratio | 0 |
| Price to Book value | 1.66 |
| Price to Sales | 3.75 |
| Price to Cash Flow | -7.84 |
| Dividend | 0 |
| Forward Dividend | 0 |
| Dividend Yield | 0% |
| Dividend Pay Date | Invalid DateTime. |
| Ex-Dividend Date | Invalid DateTime. |

|

|
|

|
|
|
|
|
|