| 0 (0%) | 04-19 11:03 | |||||||||||||
|
|
| Short term | ||||
| Mid term | |
|||
| Targets | 6-month : | 0.08 | 1-year : | 0.11 |
| Resists | First : | 0.07 | Second : | 0.1 |
| Pivot price | 0.04 |
|||
| Supports | First : | 0.03 | Second : | 0.02 |
| MAs | MA(5) : | 0.04 |
MA(20) : | 0.05 |
| MA(100) : | 1.31 |
MA(250) : | 11.02 |
|
| MACD | MACD : | -0.1 |
Signal : | -0.1 |
| %K %D | K(14,3) : | 25.1 |
D(3) : | 25.1 |
| RSI | RSI(14): 36.1 |
|||
| 52-week | High : | 52.4 | Low : | 0.03 |
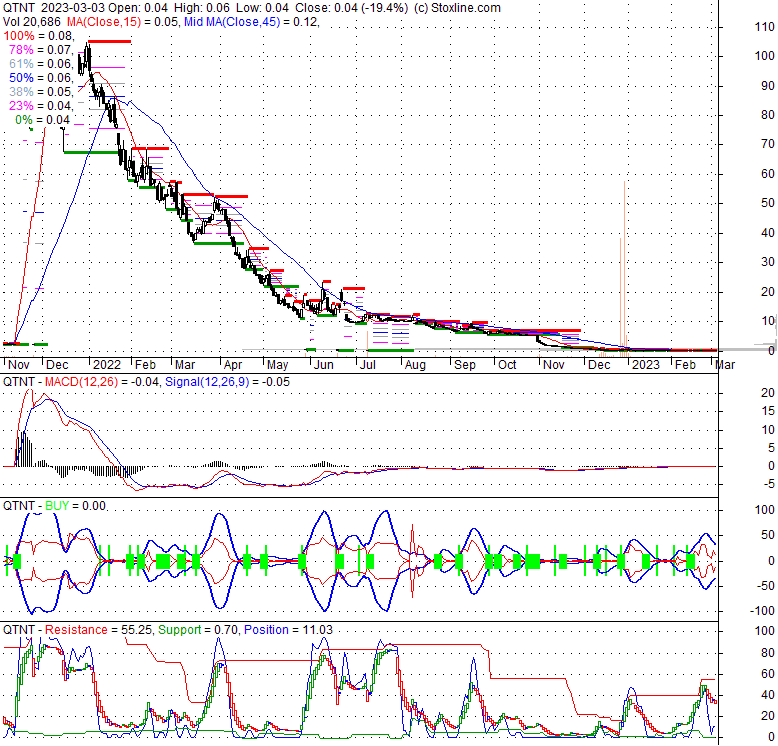
Price has closed below its short-term moving average. Short-term moving average is currently below mid-term; and below long-term moving average. From the relationship between price and moving averages: This stock is BEARISH in short-term; and BEARISH in mid-long term.[ QTNT ] has closed above bottom band by 25.5%. Bollinger Bands are 97.1% narrower than normal. The narrow width of the bands suggests low volatility as compared to its normal range. The bands have been in this narrow range for 70 bars. This is a sign that the market may be about to initiate a new trend.
| If tomorrow: | Open lower | Open higher |
| High: | 0.06 - 0.06 | 0.06 - 0.06 |
| Low: | 0.04 - 0.04 | 0.04 - 0.04 |
| Close: | 0.04 - 0.04 | 0.04 - 0.04 |
Thu, 04 Apr 2024
What TriQuint Semiconductor's Earnings Headlines Didn't Tell You - Yahoo Movies UK
Tue, 13 Jan 2015
After TriQuint, what's next for former CEO Ralph Quinsey? - Portland Business Journal - The Business Journals
Fri, 19 Sep 2014
How RF Micro Devices Inc. and TriQuint Semiconductor Inc. came up with the name 'Qorvo' - The Business Journals
Thu, 18 Sep 2014
RFMD and TriQuint Unveil New Company Name: QorvoTM - Business Wire
Mon, 24 Feb 2014
Mid-Morning Market Update: Markets Open Higher; Men's Wearhouse Lifts Offer For Jos. A. Bank - Armstrong - Benzinga
Tue, 29 Oct 2013
Five Semiconductor Companies Leading the S&P 500 - TheStreet
| Price to Book Value: P/BV, a ratio used to compare book value to its current market price, to gauge whether a stock is valued properly. |
Neutral |
| Price to Earnings: PE, the ratio for valuing a company that measures its current share price relative to its earnings per share (EPS). |
Neutral |
| Discounted cash flow: DCF, a valuation method used to estimate the value of an investment based on its expected future cash flows. |
Neutral |
| Return on Assets: ROA, indicates how profitable a company is in relation to its total assets, how efficiently uses assets to generate a profit. |
Neutral |
| Return on Equity: ROE, a measure of financial performance calculated by dividing net income by equity. a gauge of profitability and efficiency. |
Neutral |
| Debt to Equity: evaluate financial leverage, reflects the ability of equity to cover outstanding debts in the event of a business downturn. |
Neutral |
|
Exchange:
|
|
|
Sector:
|
|
|
Industry:
|
|
| Shares Out | 0 (M) |
| Shares Float | 0 (M) |
| Held by Insiders | 0 (%) |
| Held by Institutions | 0 (%) |
| Shares Short | 0 (K) |
| Shares Short P.Month | 0 (K) |
| EPS | 0 |
| EPS Est Next Qtrly | -0.59 |
| EPS Est This Year | -2.01 |
| EPS Est Next Year | -1.3 |
| Book Value (p.s.) | 0 |
| Profit Margin | 0 % |
| Operating Margin | 0 % |
| Return on Assets (ttm) | 0 % |
| Return on Equity (ttm) | 0 % |
| Qtrly Rev. Growth | 0 % |
| Gross Profit (p.s.) | 0.14 |
| Sales Per Share | 0.37 |
| EBITDA (p.s.) | -0.99 |
| Qtrly Earnings Growth | 0 % |
| Operating Cash Flow | 0 (M) |
| Levered Free Cash Flow | 0 (M) |
| PE Ratio | 0 |
| PEG Ratio | 0 |
| Price to Book value | 0 |
| Price to Sales | 0.1 |
| Price to Cash Flow | 0 |
| Dividend | 0 |
| Forward Dividend | 0 |
| Dividend Yield | 0% |
| Dividend Pay Date | Invalid DateTime. |
| Ex-Dividend Date | Invalid DateTime. |

|

|
|

|
|
|
|
|
|