| 22.4562 0.703 (3.23%) | 04-24 11:09 | |||||||||||||
|
|
| Short term | ||||
| Mid term | ||||
| Targets | 6-month : | 27.08 |
1-year : | 31.64 |
| Resists | First : | 23.19 |
Second : | 27.08 |
| Pivot price | 22.55 |
|||
| Supports | First : | 22.27 |
Second : | 21.7 |
| MAs | MA(5) : | 21.96 |
MA(20) : | 22.67 |
| MA(100) : | 23.93 |
MA(250) : | 25.06 |
|
| MACD | MACD : | -0.3 |
Signal : | -0.3 |
| %K %D | K(14,3) : | 22.3 |
D(3) : | 15 |
| RSI | RSI(14): 46.1 |
|||
| 52-week | High : | 28.47 | Low : | 21.7 |
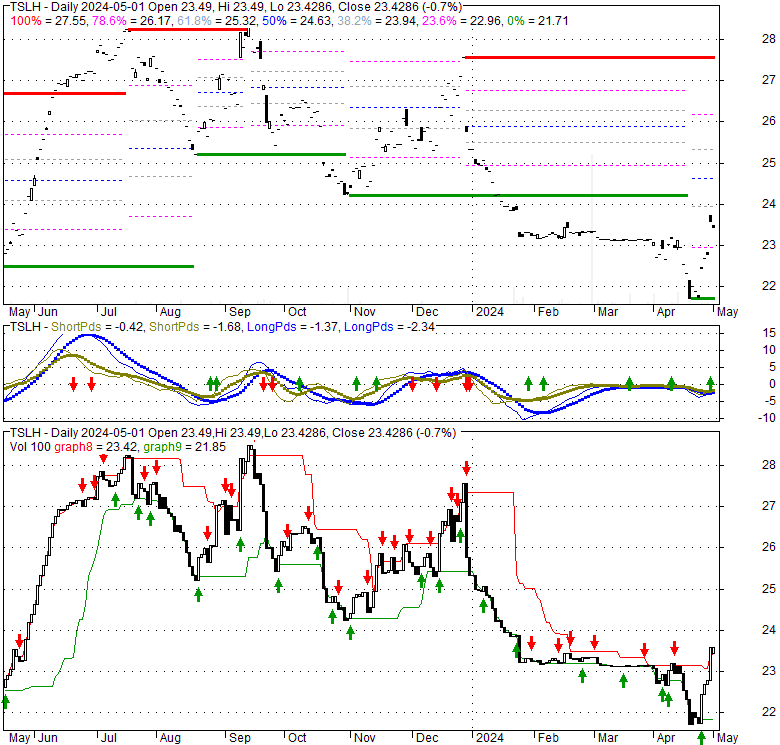
Price has closed above its short-term moving average. Short-term moving average is currently below mid-term; and below long-term moving average. From the relationship between price and moving averages: This stock is NEUTRAL in short-term; and BEARISH in mid-long term.[ TSLH ] has closed above bottom band by 45.7%. Bollinger Bands are 50.3% wider than normal. The large width of the bands suggest high volatility as compared to its normal range. The bands have been in this wide range for 1 days. This is a sign that the current trend might continue.
| If tomorrow: | Open lower | Open higher |
| High: | 22.5 - 22.63 | 22.63 - 22.74 |
| Low: | 22.13 - 22.3 | 22.3 - 22.45 |
| Close: | 22.23 - 22.47 | 22.47 - 22.69 |
The fund will seek to participate in the price return of TSLA, subject to a limit on investment gains (prior to taking into account management fees and other fees) and will seek to provide the Floor against TSLA losses, up to a limit through the Sub-Adviser’s investments in the Options Portfolio and Treasury Portfolio. It is non-diversified.
Wed, 31 Jan 2024
What Are Single-Stock ETFs? - NerdWallet
Wed, 07 Jun 2023
Overlooked Single-Stock ETF Angle Could Attract Investor Interest - ETF Trends
Thu, 20 Apr 2023
New YieldMax ETF Offers Income, Exposure to Apple Stock - Yahoo Finance
Tue, 03 Jan 2023
Innovator Announces Record Year for Defined Outcome ETFs™ as Bonds and Stocks Declined Together, Publishes ... - GlobeNewswire
Mon, 15 Aug 2022
Investing Strategy: Single Stock & Bond ETFs: What Are They & Should You Consider Buying Them - TheStreet
Sun, 14 Aug 2022
Tesla hedging: New ETF gears up to attract hesitant investors - CNBC
| Price to Book Value: P/BV, a ratio used to compare book value to its current market price, to gauge whether a stock is valued properly. |
Neutral |
| Price to Earnings: PE, the ratio for valuing a company that measures its current share price relative to its earnings per share (EPS). |
Neutral |
| Discounted cash flow: DCF, a valuation method used to estimate the value of an investment based on its expected future cash flows. |
Neutral |
| Return on Assets: ROA, indicates how profitable a company is in relation to its total assets, how efficiently uses assets to generate a profit. |
Neutral |
| Return on Equity: ROE, a measure of financial performance calculated by dividing net income by equity. a gauge of profitability and efficiency. |
Neutral |
| Debt to Equity: evaluate financial leverage, reflects the ability of equity to cover outstanding debts in the event of a business downturn. |
Neutral |
|
Exchange:
ETF
|
|
|
Sector:
Financial Services
|
|
|
Industry:
Asset Management
|
|
| Shares Out | 0 (M) |
| Shares Float | 0 (M) |
| Held by Insiders | 0 (%) |
| Held by Institutions | 0 (%) |
| Shares Short | 0 (K) |
| Shares Short P.Month | 0 (K) |
| EPS | 0 |
| EPS Est Next Qtrly | 0 |
| EPS Est This Year | 0 |
| EPS Est Next Year | 0 |
| Book Value (p.s.) | 0 |
| Profit Margin | 0 % |
| Operating Margin | 0 % |
| Return on Assets (ttm) | 0 % |
| Return on Equity (ttm) | 0 % |
| Qtrly Rev. Growth | 0 % |
| Gross Profit (p.s.) | 0 |
| Sales Per Share | 0 |
| EBITDA (p.s.) | 0 |
| Qtrly Earnings Growth | 0 % |
| Operating Cash Flow | 0 (M) |
| Levered Free Cash Flow | 0 (M) |
| PE Ratio | 0 |
| PEG Ratio | 0 |
| Price to Book value | 0 |
| Price to Sales | 0 |
| Price to Cash Flow | 0 |
| Dividend | 0 |
| Forward Dividend | 0 |
| Dividend Yield | 0% |
| Dividend Pay Date | Invalid DateTime. |
| Ex-Dividend Date | Invalid DateTime. |

|

|
|

|
|
|
|
|
|