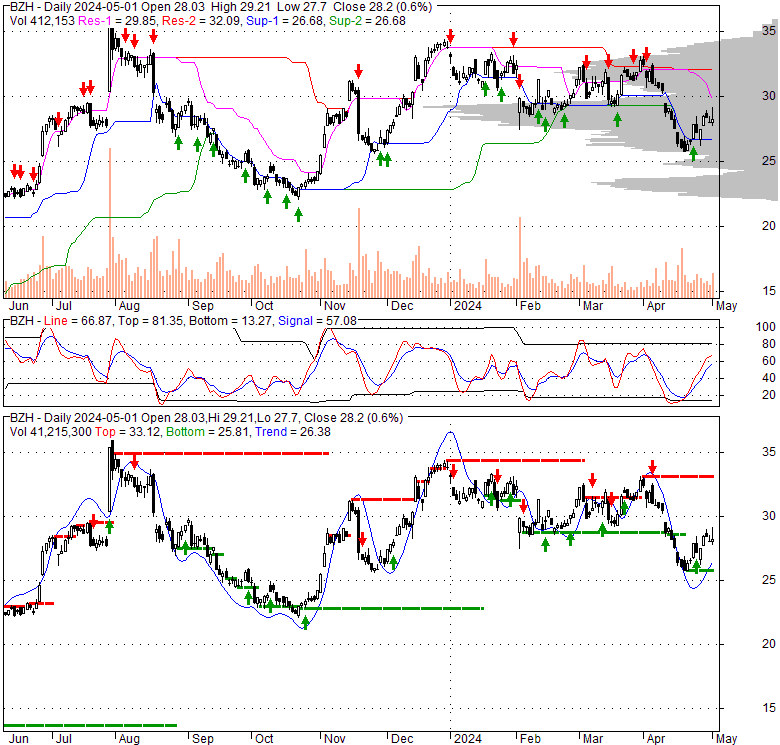
| 25.79 -0.27 (-1.04%) | 04-18 16:00 | |||||||||||||
|
|
| Short term | |
|||
| Mid term | ||||
| Targets | 6-month : | 35.44 |
1-year : | 38.75 |
| Resists | First : | 30.34 |
Second : | 33.18 |
| Pivot price | 29.56 |
|||
| Supports | First : | 25.77 |
Second : | 21.44 |
| MAs | MA(5) : | 26.8 |
MA(20) : | 30.06 |
| MA(100) : | 30.51 |
MA(250) : | 27.55 |
|
| MACD | MACD : | -1.2 |
Signal : | -0.6 |
| %K %D | K(14,3) : | 2.3 |
D(3) : | 2.5 |
| RSI | RSI(14): 26.9 |
|||
| 52-week | High : | 35.93 | Low : | 16.68 |
Price has closed below its short-term moving average. Short-term moving average is currently below mid-term; and below long-term moving average. From the relationship between price and moving averages: This stock is BEARISH in short-term; and BEARISH in mid-long term.[ BZH ] has closed above bottom band by 8.3%. Bollinger Bands are 89.1% wider than normal. The large width of the bands suggest high volatility as compared to its normal range. The bands have been in this wide range for 2 days. This is a sign that the current trend might continue.
| If tomorrow: | Open lower | Open higher |
| High: | 27.13 - 27.39 | 27.39 - 27.55 |
| Low: | 25.23 - 25.56 | 25.56 - 25.76 |
| Close: | 25.41 - 25.95 | 25.95 - 26.28 |
Beazer Homes USA, Inc. operates as a homebuilder in the United States. It designs, constructs, and sells single-family and multi-family homes under the Beazer Homes, Gatherings, and Choice Plans names. The company sells its homes through commissioned new home sales counselors and independent brokers in Arizona, California, Nevada, Texas, Delaware, Maryland, Indiana, Tennessee, Virginia, Florida, Georgia, North Carolina, and South Carolina. Beazer Homes USA, Inc. was founded in 1985 and is headquartered in Atlanta, Georgia.
Wed, 17 Apr 2024
DekaBank Deutsche Girozentrale Sells 2755 Shares of Beazer Homes USA, Inc. (NYSE:BZH) - Defense World
Tue, 16 Apr 2024
Beazer Homes USA (NYSE:BZH) Shares Down 4.6% - MarketBeat
Wed, 10 Apr 2024
Beazer Homes USA (BZH) Shares Cross Below 200 DMA - Nasdaq
Tue, 09 Apr 2024
Improved Earnings Required Before Beazer Homes USA, Inc. (NYSE:BZH) Shares Find Their Feet - Simply Wall St
Fri, 05 Apr 2024
SG Americas Securities LLC Sells 37744 Shares of Beazer Homes USA, Inc. (NYSE:BZH) - Defense World
Fri, 05 Apr 2024
Beazer Homes USA's (NYSE:BZH) earnings growth rate lags the 20% CAGR delivered to shareholders - Yahoo Finance
| Price to Book Value: P/BV, a ratio used to compare book value to its current market price, to gauge whether a stock is valued properly. |
Underperform |
| Price to Earnings: PE, the ratio for valuing a company that measures its current share price relative to its earnings per share (EPS). |
Neutral |
| Discounted cash flow: DCF, a valuation method used to estimate the value of an investment based on its expected future cash flows. |
Outperform |
| Return on Assets: ROA, indicates how profitable a company is in relation to its total assets, how efficiently uses assets to generate a profit. |
Neutral |
| Return on Equity: ROE, a measure of financial performance calculated by dividing net income by equity. a gauge of profitability and efficiency. |
Neutral |
| Debt to Equity: evaluate financial leverage, reflects the ability of equity to cover outstanding debts in the event of a business downturn. |
Outperform |
|
Exchange:
NYSE
|
|
|
Sector:
Consumer Cyclical
|
|
|
Industry:
Residential Construction
|
|
| Shares Out | 32 (M) |
| Shares Float | 28 (M) |
| Held by Insiders | 6.4 (%) |
| Held by Institutions | 87.6 (%) |
| Shares Short | 959 (K) |
| Shares Short P.Month | 1,080 (K) |
| EPS | 5.05 |
| EPS Est Next Qtrly | 0 |
| EPS Est This Year | 0 |
| EPS Est Next Year | 0 |
| Book Value (p.s.) | 35.54 |
| Profit Margin | 7.2 % |
| Operating Margin | 5.2 % |
| Return on Assets (ttm) | 4.6 % |
| Return on Equity (ttm) | 14.9 % |
| Qtrly Rev. Growth | -13.2 % |
| Gross Profit (p.s.) | 0 |
| Sales Per Share | 68.16 |
| EBITDA (p.s.) | 5.75 |
| Qtrly Earnings Growth | -12.2 % |
| Operating Cash Flow | 39 (M) |
| Levered Free Cash Flow | -50 (M) |
| PE Ratio | 5.09 |
| PEG Ratio | 1.5 |
| Price to Book value | 0.72 |
| Price to Sales | 0.37 |
| Price to Cash Flow | 20.72 |
| Dividend | 0 |
| Forward Dividend | 0 |
| Dividend Yield | 0% |
| Dividend Pay Date | Invalid DateTime. |
| Ex-Dividend Date | Invalid DateTime. |

|

|
|

|
|
|
|
|
|