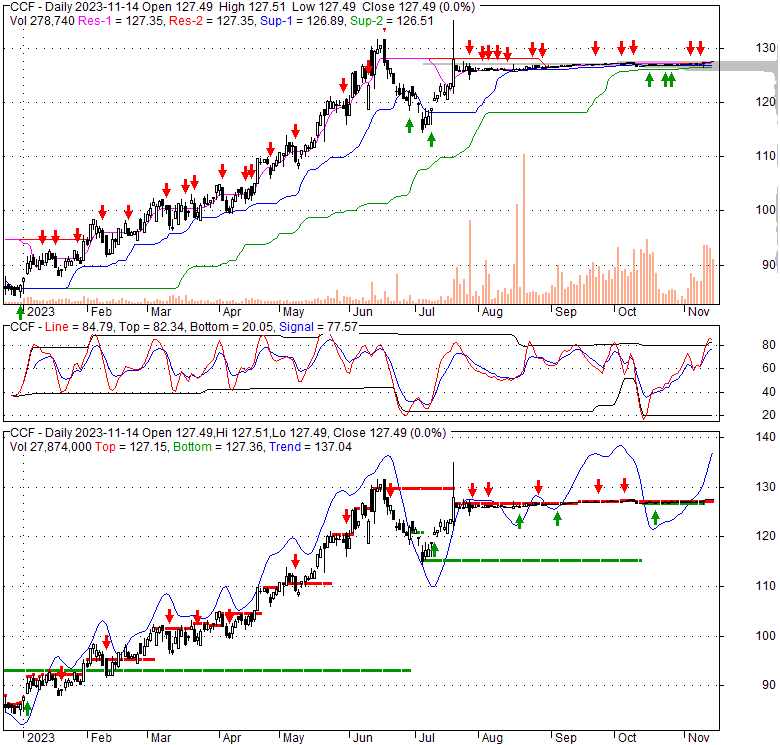
| 127.49 0.05 (0.04%) | 11-14 16:00 | |||||||||||||
|
|
| Short term | |
|||
| Mid term | ||||
| Targets | 6-month : | 148.93 |
1-year : | 173.95 |
| Resists | First : | 127.51 |
Second : | 148.93 |
| Pivot price | 127.11 |
|||
| Supports | First : | 126.78 |
Second : | 126.33 |
| MAs | MA(5) : | 127.35 |
MA(20) : | 127.05 |
| MA(100) : | 125.62 |
MA(250) : | 0 | |
| MACD | MACD : | 0.1 |
Signal : | 0 |
| %K %D | K(14,3) : | 96.8 |
D(3) : | 93 |
| RSI | RSI(14): 62.3 |
|||
| 52-week | High : | 135.27 | Low : | 81.18 |
Price has closed above its short-term moving average. Short-term moving average is currently above mid-term; and above long-term moving average. From the relationship between price and moving averages: This stock is BULLISH in short-term; and BULLISH in mid-long term.[ CCF ] has closed below upper band by 7.6%. Bollinger Bands are 77.3% narrower than normal. The narrow width of the bands suggests low volatility as compared to its normal range. The bands have been in this narrow range for 71 bars. This is a sign that the market may be about to initiate a new trend.
| If tomorrow: | Open lower | Open higher |
| High: | 127.6 - 128.21 | 128.21 - 128.78 |
| Low: | 125.9 - 126.61 | 126.61 - 127.29 |
| Close: | 126.34 - 127.44 | 127.44 - 128.48 |
Chase Corporation, a specialty chemicals company, manufactures and sells protective materials for various applications worldwide. It operates through three segments: Adhesives, Sealants and Additives; Industrial Tapes; and Corrosion Protection and Waterproofing. The Adhesives, Sealants and Additives segment offers protective conformal and moisture protective electronic coatings and cleaning solutions; advanced adhesives, sealants, and coatings; polymeric microspheres; polyurethane dispersions; superabsorbent polymers; and cleaning and protection solutions for electronic assemblies. The Industrial Tapes segment provides wire and cable materials; specialty tapes and related products; insulating and conducting materials; laminated durable papers; water-blocking compounds; laminated film foils and cover tapes; and pulling and detection tapes. The Corrosion Protection and Waterproofing segment offers protective pipe-coating tapes and other protectants; polymeric asphalt additives; waterproofing membranes; waterproofing sealants, expansion joints, and accessories; technological products, and tapes and membranes; specialized high-performance coating and lining systems; waterproofing and corrosion protection systems; and pipeline protection tapes and products. It sells its products through its salespeople, as well as manufacturers' representatives and distributors. The company was founded in 1946 and is headquartered in Westwood, Massachusetts.
Thu, 18 Apr 2024
Chase: Fiscal 4Q Earnings Snapshot - Yahoo Canada Shine On
Wed, 17 Apr 2024
Here's What Chase Corporation's (NYSEMKT:CCF) P/E Is Telling Us - Yahoo Movies Canada
Fri, 29 Mar 2024
G.research to Host 12th Annual Specialty Chemicals Conference - The Globe and Mail
Thu, 25 Jan 2024
Inogen Hires Michael Bourque to Assume the Role of CFO - CEOWORLD magazine
Wed, 24 Jan 2024
Inogen Names Michael Bourque as New Chief Financial Officer - Business Wire
Mon, 24 Jul 2023
KKR Buying Protective Materials Company Chase Corporation For $1.3 Billion - Pulse 2.0
| Price to Book Value: P/BV, a ratio used to compare book value to its current market price, to gauge whether a stock is valued properly. |
Outperform |
| Price to Earnings: PE, the ratio for valuing a company that measures its current share price relative to its earnings per share (EPS). |
Outperform |
| Discounted cash flow: DCF, a valuation method used to estimate the value of an investment based on its expected future cash flows. |
Outperform |
| Return on Assets: ROA, indicates how profitable a company is in relation to its total assets, how efficiently uses assets to generate a profit. |
Outperform |
| Return on Equity: ROE, a measure of financial performance calculated by dividing net income by equity. a gauge of profitability and efficiency. |
Outperform |
| Debt to Equity: evaluate financial leverage, reflects the ability of equity to cover outstanding debts in the event of a business downturn. |
Outperform |

|
Exchange:
AMEX
|
|
|
Sector:
Basic Materials
|
|
|
Industry:
Chemicals - Specialty
|
|
| Shares Out | 10 (M) |
| Shares Float | 7 (M) |
| Held by Insiders | 21 (%) |
| Held by Institutions | 72 (%) |
| Shares Short | 297 (K) |
| Shares Short P.Month | 109 (K) |
| EPS | 3.48 |
| EPS Est Next Qtrly | 0 |
| EPS Est This Year | 0 |
| EPS Est Next Year | 0 |
| Book Value (p.s.) | 43.25 |
| Profit Margin | 8.2 % |
| Operating Margin | 15 % |
| Return on Assets (ttm) | 6.3 % |
| Return on Equity (ttm) | 8.5 % |
| Qtrly Rev. Growth | 13.8 % |
| Gross Profit (p.s.) | 12.91 |
| Sales Per Share | 42.43 |
| EBITDA (p.s.) | 9.89 |
| Qtrly Earnings Growth | -43.5 % |
| Operating Cash Flow | 74 (M) |
| Levered Free Cash Flow | 54 (M) |
| PE Ratio | 36.63 |
| PEG Ratio | 0 |
| Price to Book value | 2.94 |
| Price to Sales | 3 |
| Price to Cash Flow | 16.32 |
| Dividend | 1 |
| Forward Dividend | 0 |
| Dividend Yield | 0.7% |
| Dividend Pay Date | Invalid DateTime. |
| Ex-Dividend Date | Invalid DateTime. |