| 23.15 -0.06 (-0.26%) | 04-24 11:42 | |||||||||||||
|
|
| Short term | |
|||
| Mid term | ||||
| Targets | 6-month : | 28.3 | 1-year : | 33.05 |
| Resists | First : | 24.22 | Second : | 28.3 |
| Pivot price | 23.21 |
|||
| Supports | First : | 22.88 | Second : | 22.05 |
| MAs | MA(5) : | 22.89 |
MA(20) : | 23.37 |
| MA(100) : | 22.59 |
MA(250) : | 21.11 |
|
| MACD | MACD : | -0.2 |
Signal : | -0.2 |
| %K %D | K(14,3) : | 50 |
D(3) : | 41.6 |
| RSI | RSI(14): 48.7 |
|||
| 52-week | High : | 25.06 | Low : | 16.87 |
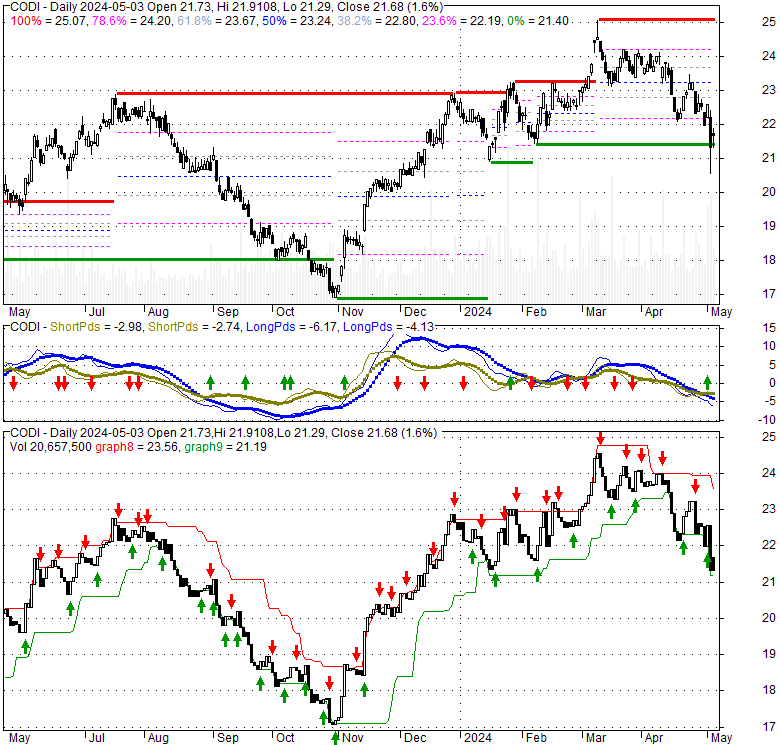
Price has closed above its short-term moving average. Short-term moving average is currently below mid-term; and above long-term moving average. From the relationship between price and moving averages: This stock is NEUTRAL in short-term; and NEUTRAL in mid-long term.[ CODI ] has closed above bottom band by 47.8%. Bollinger Bands are 31.9% wider than normal. The current width of the bands does not suggest anything about the future direction or movement of prices.
| If tomorrow: | Open lower | Open higher |
| High: | 23.5 - 23.58 | 23.58 - 23.66 |
| Low: | 22.78 - 22.89 | 22.89 - 22.99 |
| Close: | 23.04 - 23.19 | 23.19 - 23.32 |
Compass Diversified is a private equity firm specializing in add on acquisitions, buyouts, industry consolidation, recapitalization, late stage and middle market investments. It seeks to invest in niche industrial or branded consumer companies, manufacturing, distribution, consumer products, business services sector, safety & security, electronic components, food, foodservice. The firm prefers to invest in companies based in North America. It seeks to invest between $100 million and $800 million in companies with an EBITDA between $15 million to $80 million. It seeks to acquire controlling ownership interests in its portfolio companies and can make additional platform acquisitions. The firm prefer to have majority stake in companies. The firm invests through its balance sheet and typically holds investments between five to seven years. Compass Diversified was founded in 2005 and is based in Westport, Connecticut with an additional office in Costa Mesa, California.
Tue, 23 Apr 2024
International Assets Investment Management LLC Takes Position in Compass Diversified (NYSE:CODI) - MarketBeat
Sun, 21 Apr 2024
Kornitzer Capital Management Inc. KS Raises Holdings in Compass Diversified (NYSE:CODI) - MarketBeat
Thu, 18 Apr 2024
Compass Diversified-Backed The Honey Pot Co. Strengthens Its Board With The Appointment of Three New Directors - Yahoo Finance
Wed, 17 Apr 2024
Compass Diversified Announces First Quarter 2024 Earnings and Conference Call Information - Yahoo Finance
Tue, 16 Apr 2024
Compass Diversified Holdings's Dividend Analysis - Yahoo Finance
Mon, 08 Apr 2024
Compass Diversified (NYSE:CODI) Is Due To Pay A Dividend Of $0.25 - Yahoo Finance
| Price to Book Value: P/BV, a ratio used to compare book value to its current market price, to gauge whether a stock is valued properly. |
Underperform |
| Price to Earnings: PE, the ratio for valuing a company that measures its current share price relative to its earnings per share (EPS). |
Underperform |
| Discounted cash flow: DCF, a valuation method used to estimate the value of an investment based on its expected future cash flows. |
Neutral |
| Return on Assets: ROA, indicates how profitable a company is in relation to its total assets, how efficiently uses assets to generate a profit. |
Outperform |
| Return on Equity: ROE, a measure of financial performance calculated by dividing net income by equity. a gauge of profitability and efficiency. |
Outperform |
| Debt to Equity: evaluate financial leverage, reflects the ability of equity to cover outstanding debts in the event of a business downturn. |
Outperform |
|
Exchange:
NYSE
|
|
|
Sector:
Industrials
|
|
|
Industry:
Conglomerates
|
|
| Shares Out | 75 (M) |
| Shares Float | 66 (M) |
| Held by Insiders | 13.1 (%) |
| Held by Institutions | 52.2 (%) |
| Shares Short | 886 (K) |
| Shares Short P.Month | 845 (K) |
| EPS | -1.72 |
| EPS Est Next Qtrly | 0 |
| EPS Est This Year | 0 |
| EPS Est Next Year | 0 |
| Book Value (p.s.) | 13.59 |
| Profit Margin | 11.9 % |
| Operating Margin | 5.7 % |
| Return on Assets (ttm) | 2.9 % |
| Return on Equity (ttm) | -2.7 % |
| Qtrly Rev. Growth | 3.9 % |
| Gross Profit (p.s.) | 0 |
| Sales Per Share | 27.33 |
| EBITDA (p.s.) | 4.3 |
| Qtrly Earnings Growth | 0 % |
| Operating Cash Flow | 78 (M) |
| Levered Free Cash Flow | 96 (M) |
| PE Ratio | -13.55 |
| PEG Ratio | 1.5 |
| Price to Book value | 1.7 |
| Price to Sales | 0.84 |
| Price to Cash Flow | 22.35 |
| Dividend | 0 |
| Forward Dividend | 0 |
| Dividend Yield | 0% |
| Dividend Pay Date | Invalid DateTime. |
| Ex-Dividend Date | Invalid DateTime. |

|

|
|

|
|
|
|
|
|