| 48.11 0.32 (0.67%) | 04-18 16:00 | |||||||||||||
|
|
| Short term | ||||
| Mid term | |
|||
| Targets | 6-month : | 57.63 | 1-year : | 58.8 |
| Resists | First : | 49.34 | Second : | 50.34 |
| Pivot price | 48.81 |
|||
| Supports | First : | 47.71 | Second : | 39.69 |
| MAs | MA(5) : | 48.11 |
MA(20) : | 49.04 |
| MA(100) : | 49.54 |
MA(250) : | 50.95 |
|
| MACD | MACD : | -0.4 |
Signal : | -0.3 |
| %K %D | K(14,3) : | 7.5 |
D(3) : | 9.8 |
| RSI | RSI(14): 42.8 |
|||
| 52-week | High : | 58.18 | Low : | 45.56 |
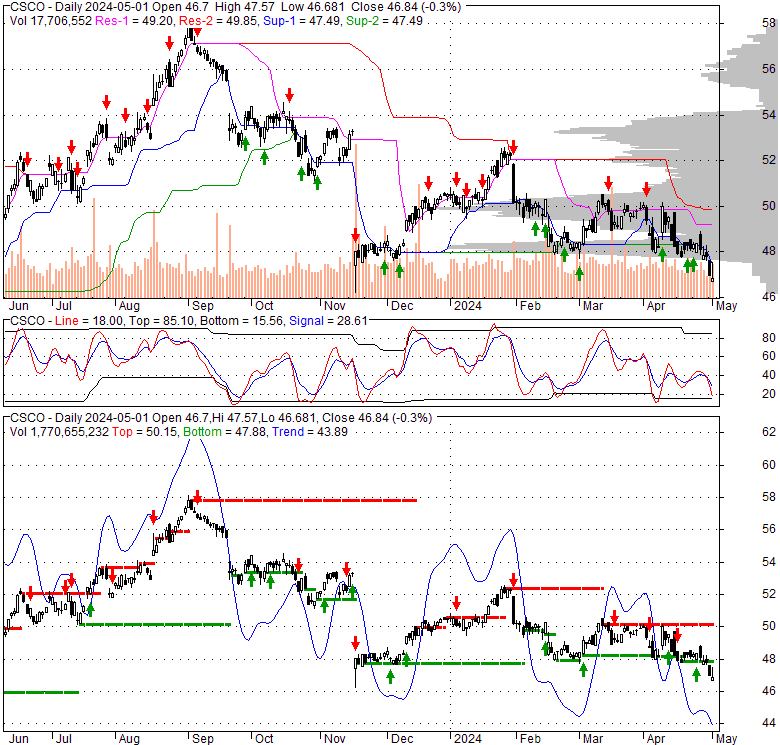
Price has closed below its short-term moving average. Short-term moving average is currently below mid-term; and below long-term moving average. From the relationship between price and moving averages: This stock is NEUTRAL in short-term; and BEARISH in mid-long term.[ CSCO ] has closed above bottom band by 26.9%. Bollinger Bands are 2.5% wider than normal. The current width of the bands does not suggest anything about the future direction or movement of prices.
| If tomorrow: | Open lower | Open higher |
| High: | 48.52 - 48.84 | 48.84 - 49.13 |
| Low: | 47.07 - 47.49 | 47.49 - 47.87 |
| Close: | 47.47 - 48.12 | 48.12 - 48.71 |
Cisco Systems, Inc. designs, manufactures, and sells Internet Protocol based networking and other products related to the communications and information technology industry in the Americas, Europe, the Middle East, Africa, the Asia Pacific, Japan, and China. It provides infrastructure platforms, including networking technologies of switching, routing, wireless, and data center products that are designed to work together to deliver networking capabilities, and transport and/or store data. The company also offers collaboration products comprising unified communications, Cisco TelePresence, and conferencing, as well as the Internet of Things and analytics software. In addition, it provides security products, such as network security, cloud and email security, identity and access management, advanced threat protection, and unified threat management products. Further, the company offers a range of service and support options for its customers, including technical support and advanced services. It serves businesses of various sizes, public institutions, governments, and service providers. The company sells its products and services directly, as well as through systems integrators, service providers, other resellers, and distributors. Cisco Systems, Inc. has strategic alliances with other companies. Cisco Systems, Inc. was incorporated in 1984 and is headquartered in San Jose, California.
Thu, 18 Apr 2024
Cisco Systems Inc. stock outperforms competitors on strong trading day - MarketWatch
Thu, 18 Apr 2024
Wright Investors Service Inc. Sells 48,080 Shares of Cisco Systems, Inc. (NASDAQ:CSCO) - MarketBeat
Thu, 18 Apr 2024
BofA's US 1 List - New additions include CSCO, GS and SPGI (NASDAQ:CSCO) - Seeking Alpha
Thu, 18 Apr 2024
Cisco Systems, Inc. (CSCO) Is a Trending Stock: Facts to Know Before Betting on It - Yahoo Finance
Thu, 18 Apr 2024
Cisco Systems, Inc. (NASDAQ:CSCO) Short Interest Up 5.5% in March - Defense World
Wed, 17 Apr 2024
Cisco Won't Stay This Cheap For Long (NASDAQ:CSCO) - Seeking Alpha
| Price to Book Value: P/BV, a ratio used to compare book value to its current market price, to gauge whether a stock is valued properly. |
Outperform |
| Price to Earnings: PE, the ratio for valuing a company that measures its current share price relative to its earnings per share (EPS). |
Outperform |
| Discounted cash flow: DCF, a valuation method used to estimate the value of an investment based on its expected future cash flows. |
Outperform |
| Return on Assets: ROA, indicates how profitable a company is in relation to its total assets, how efficiently uses assets to generate a profit. |
Outperform |
| Return on Equity: ROE, a measure of financial performance calculated by dividing net income by equity. a gauge of profitability and efficiency. |
Outperform |
| Debt to Equity: evaluate financial leverage, reflects the ability of equity to cover outstanding debts in the event of a business downturn. |
Outperform |
|
Exchange:
NASDAQ
|
|
|
Sector:
Technology
|
|
|
Industry:
Communication Equipment
|
|
| Shares Out | 4,050 (M) |
| Shares Float | 4,040 (M) |
| Held by Insiders | 0 (%) |
| Held by Institutions | 77.9 (%) |
| Shares Short | 46,710 (K) |
| Shares Short P.Month | 42,280 (K) |
| EPS | 3.28 |
| EPS Est Next Qtrly | 0 |
| EPS Est This Year | 0 |
| EPS Est Next Year | 0 |
| Book Value (p.s.) | 11.42 |
| Profit Margin | 23.4 % |
| Operating Margin | 24.2 % |
| Return on Assets (ttm) | 10.1 % |
| Return on Equity (ttm) | 30.6 % |
| Qtrly Rev. Growth | -6 % |
| Gross Profit (p.s.) | 0 |
| Sales Per Share | 14.13 |
| EBITDA (p.s.) | 4.36 |
| Qtrly Earnings Growth | -3.1 % |
| Operating Cash Flow | 14,360 (M) |
| Levered Free Cash Flow | 13,750 (M) |
| PE Ratio | 14.62 |
| PEG Ratio | 3.2 |
| Price to Book value | 4.21 |
| Price to Sales | 3.4 |
| Price to Cash Flow | 13.56 |
| Dividend | 0 |
| Forward Dividend | 0 |
| Dividend Yield | 0% |
| Dividend Pay Date | Invalid DateTime. |
| Ex-Dividend Date | Invalid DateTime. |

|

|
|

|
|
|
|
|
|