| 1.1 0 (0%) | 04-16 14:22 | |||||||||||||
|
|
| Short term | |
|||
| Mid term | |
|||
| Targets | 6-month : | 1.24 | 1-year : | 1.33 |
| Resists | First : | 1.06 | Second : | 1.13 |
| Pivot price | 1.05 |
|||
| Supports | First : | 0.93 | Second : | 0.78 |
| MAs | MA(5) : | 0.98 |
MA(20) : | 1.07 |
| MA(100) : | 1.21 |
MA(250) : | 1.36 |
|
| MACD | MACD : | -0.1 |
Signal : | -0.1 |
| %K %D | K(14,3) : | 0 | D(3) : | 2.7 |
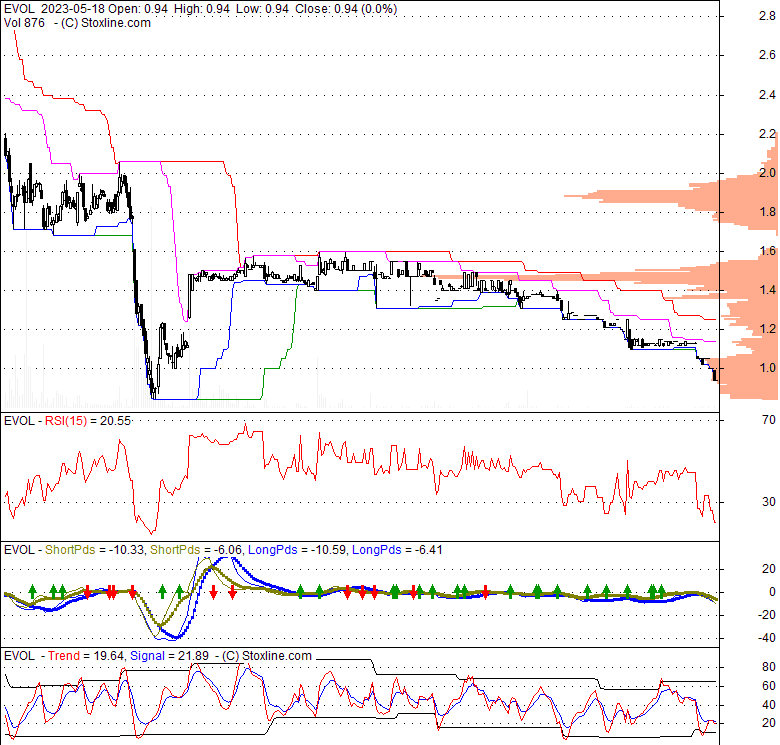
| RSI | RSI(14): 19.6 | |||
| 52-week | High : | 1.6 | Low : | 0.93 |
Price has closed below its short-term moving average. Short-term moving average is currently below mid-term; and below long-term moving average. From the relationship between price and moving averages: This stock is BEARISH in short-term; and BEARISH in mid-long term.[ EVOL ] has closed above bottom band by 5.9%. Bollinger Bands are 138.7% wider than normal. The large width of the bands suggest high volatility as compared to its normal range. The bands have been in this wide range for 7 days. This is a sign that the current trend might continue.
| If tomorrow: | Open lower | Open higher |
| High: | 0.94 - 0.95 | 0.95 - 0.95 |
| Low: | 0.93 - 0.93 | 0.93 - 0.94 |
| Close: | 0.93 - 0.94 | 0.94 - 0.95 |
Symbolic Logic, Inc., a research and development organization, focuses on developing proprietary algorithms that model and predict behaviour of dynamic systems. It is also developing a set of tools and technologies for applying symbolic content to physical objects to catalog to track real-world objects. The company was formerly known as Evolving Systems, Inc. and changed its name to Symbolic Logic, Inc. in April 2022. The company was founded in 1985 and is headquartered in Englewood, Colorado.
Mon, 08 Apr 2024
Analysts Issue Forecasts for PlayAGS Inc's Q1 2025 Earnings (NYSE:AGS) - Defense World
Mon, 08 Apr 2024
Brokers Set Expectations for Evolution Petroleum Co.'s Q1 2025 Earnings (NYSEAMERICAN:EPM) - Defense World
Mon, 08 Apr 2024
Symbolic Logic (NASDAQ:EVOL) Earns Buy Rating from Analysts at StockNews.com - Defense World
Tue, 19 Apr 2022
Will Symbolic Logic Inc (EVOL) Underperform the Rest of the Stocks in the Technology Sector? - InvestorsObserver
Sun, 20 Sep 2020
Why we heal: The evolution of psychological healing and implications for global mental health - ScienceDirect.com
| Price to Book Value: P/BV, a ratio used to compare book value to its current market price, to gauge whether a stock is valued properly. |
Underperform |
| Price to Earnings: PE, the ratio for valuing a company that measures its current share price relative to its earnings per share (EPS). |
Neutral |
| Discounted cash flow: DCF, a valuation method used to estimate the value of an investment based on its expected future cash flows. |
Outperform |
| Return on Assets: ROA, indicates how profitable a company is in relation to its total assets, how efficiently uses assets to generate a profit. |
Neutral |
| Return on Equity: ROE, a measure of financial performance calculated by dividing net income by equity. a gauge of profitability and efficiency. |
Underperform |
| Debt to Equity: evaluate financial leverage, reflects the ability of equity to cover outstanding debts in the event of a business downturn. |
Underperform |
|
Exchange:
PNK
|
|
|
Sector:
Technology
|
|
|
Industry:
Software - Application
|
|
| Shares Out | 11 (M) |
| Shares Float | 3 (M) |
| Held by Insiders | 68 (%) |
| Held by Institutions | 0 (%) |
| Shares Short | 6 (K) |
| Shares Short P.Month | 16 (K) |
| EPS | -0.38 |
| EPS Est Next Qtrly | 0 |
| EPS Est This Year | 0.25 |
| EPS Est Next Year | 0.34 |
| Book Value (p.s.) | 2.7 |
| Profit Margin | 0 % |
| Operating Margin | 61.9 % |
| Return on Assets (ttm) | -10.9 % |
| Return on Equity (ttm) | -22.5 % |
| Qtrly Rev. Growth | 0 % |
| Gross Profit (p.s.) | 0 |
| Sales Per Share | -0.66 |
| EBITDA (p.s.) | -0.31 |
| Qtrly Earnings Growth | 0 % |
| Operating Cash Flow | -1 (M) |
| Levered Free Cash Flow | 2 (M) |
| PE Ratio | -2.55 |
| PEG Ratio | 0 |
| Price to Book value | 0.34 |
| Price to Sales | -1.44 |
| Price to Cash Flow | -7.17 |
| Dividend | 0.1 |
| Forward Dividend | 0 |
| Dividend Yield | 11.7% |
| Dividend Pay Date | 2016-06-30 |
| Ex-Dividend Date | 2016-05-31 |

|

|
|

|
|
|
|
|
|