| 103.14 0 (0%) | 12-31 19:00 | |||||||||||||
|
|
| Short term | |
|||
| Mid term | |
|||
| Targets | 6-month : | 103.99 | 1-year : | 106.22 |
| Resists | First : | 89.03 | Second : | 90.94 |
| Pivot price | 88.76 |
|||
| Supports | First : | 85.94 | Second : | 71.5 |
| MAs | MA(5) : | 87.12 |
MA(20) : | 88.72 |
| MA(100) : | 85.02 |
MA(250) : | 82.32 |
|
| MACD | MACD : | 0.1 |
Signal : | 0.6 |
| %K %D | K(14,3) : | 15.8 |
D(3) : | 11.7 |
| RSI | RSI(14): 44.5 |
|||
| 52-week | High : | 90.94 | Low : | 74.23 |
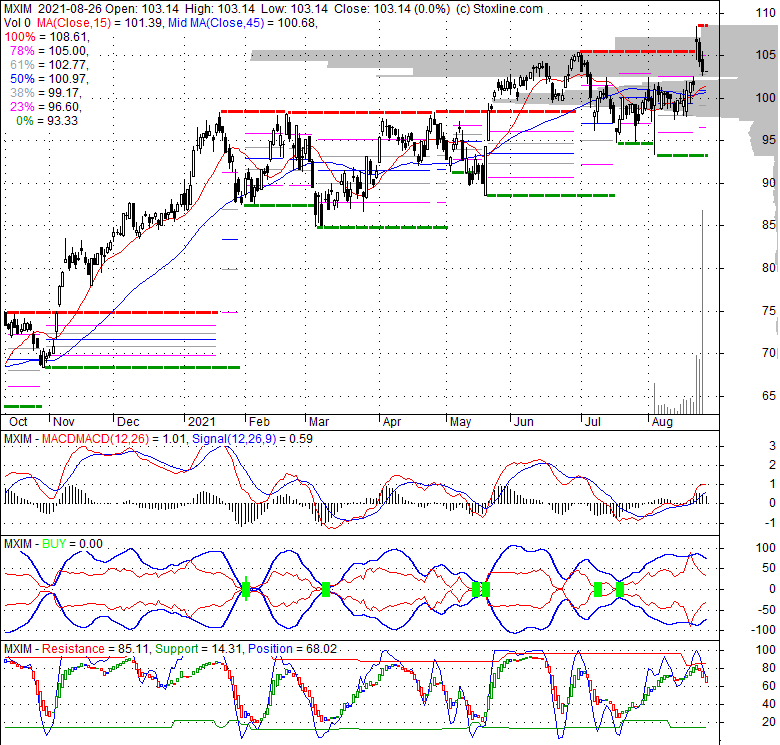
Price has closed below its short-term moving average. Short-term moving average is currently above mid-term; and above long-term moving average. From the relationship between price and moving averages: This stock is NEUTRAL in short-term; and BULLISH in mid-long term.[ MXI ] has closed above bottom band by 14.1%. Bollinger Bands are 5.8% wider than normal. The current width of the bands does not suggest anything about the future direction or movement of prices.
| If tomorrow: | Open lower | Open higher |
| High: | 87.77 - 88.19 | 88.19 - 88.57 |
| Low: | 85.89 - 86.39 | 86.39 - 86.85 |
| Close: | 86.14 - 86.95 | 86.95 - 87.68 |
Maxim Integrated Products, Inc. designs, develops, manufactures, and markets a range of linear and mixed-signal integrated circuits in the United States, China, rest of Asia, Europe, and internationally. The company also provides various high-frequency process technologies and capabilities used in custom designs. It serves automotive, communications and data center, consumer, and industrial markets. The company markets its products through a direct-sales and applications organization, as well as through its own and other unaffiliated distribution channels. Maxim Integrated Products, Inc. was founded in 1983 and is headquartered in San Jose, California.
Mon, 01 Apr 2024
Analog Devices Announces Combination with Maxim Integrated, Strengthening Analogue Semiconductor Leadership - The Engineer
Fri, 27 Aug 2021
Analog Devices Completes Acquisition of Maxim Integrated - Inside GNSS
Mon, 23 Aug 2021
Analog Devices and Maxim Integrated Announce China Antitrust Clearance for Combination - Business Wire
Tue, 27 Jul 2021
Maxim Integrated Reports Results For The Fourth Quarter Of Fiscal 2021 - PR Newswire
Mon, 18 Jan 2021
The Zacks Analyst Blog Highlights: Taiwan Semiconductor Manufacturing, Micron Technology, Power Integrations ... - Yahoo Finance
Mon, 23 Nov 2020
Maxim Integrated Appoints Yu-A Sophie Han as Country Manager and Managing Director of Maxim Korea - PR Newswire
| Price to Book Value: P/BV, a ratio used to compare book value to its current market price, to gauge whether a stock is valued properly. |
Outperform |
| Price to Earnings: PE, the ratio for valuing a company that measures its current share price relative to its earnings per share (EPS). |
Outperform |
| Discounted cash flow: DCF, a valuation method used to estimate the value of an investment based on its expected future cash flows. |
Outperform |
| Return on Assets: ROA, indicates how profitable a company is in relation to its total assets, how efficiently uses assets to generate a profit. |
Neutral |
| Return on Equity: ROE, a measure of financial performance calculated by dividing net income by equity. a gauge of profitability and efficiency. |
Outperform |
| Debt to Equity: evaluate financial leverage, reflects the ability of equity to cover outstanding debts in the event of a business downturn. |
Outperform |
|
Exchange:
NASDAQ
|
|
|
Sector:
Technology
|
|
|
Industry:
Semiconductors
|
|
| Shares Out | 0 (M) |
| Shares Float | 0 (M) |
| Held by Insiders | 0 (%) |
| Held by Institutions | 0 (%) |
| Shares Short | 0 (K) |
| Shares Short P.Month | 0 (K) |
| EPS | 0 |
| EPS Est Next Qtrly | 0 |
| EPS Est This Year | 0 |
| EPS Est Next Year | 0 |
| Book Value (p.s.) | 0 |
| Profit Margin | 0 % |
| Operating Margin | 0 % |
| Return on Assets (ttm) | 0 % |
| Return on Equity (ttm) | 0 % |
| Qtrly Rev. Growth | 0 % |
| Gross Profit (p.s.) | 0 |
| Sales Per Share | 0 |
| EBITDA (p.s.) | 0 |
| Qtrly Earnings Growth | 0 % |
| Operating Cash Flow | 0 (M) |
| Levered Free Cash Flow | 0 (M) |
| PE Ratio | 0 |
| PEG Ratio | 0 |
| Price to Book value | 0 |
| Price to Sales | 0 |
| Price to Cash Flow | 0 |
| Dividend | 0 |
| Forward Dividend | 0 |
| Dividend Yield | 0% |
| Dividend Pay Date | Invalid DateTime. |
| Ex-Dividend Date | Invalid DateTime. |

|

|
|

|
|
|
|
|
|