| 19.34 0.27 (1.42%) | 04-19 16:00 | |||||||||||||
|
|
| Short term | |
|||
| Mid term | ||||
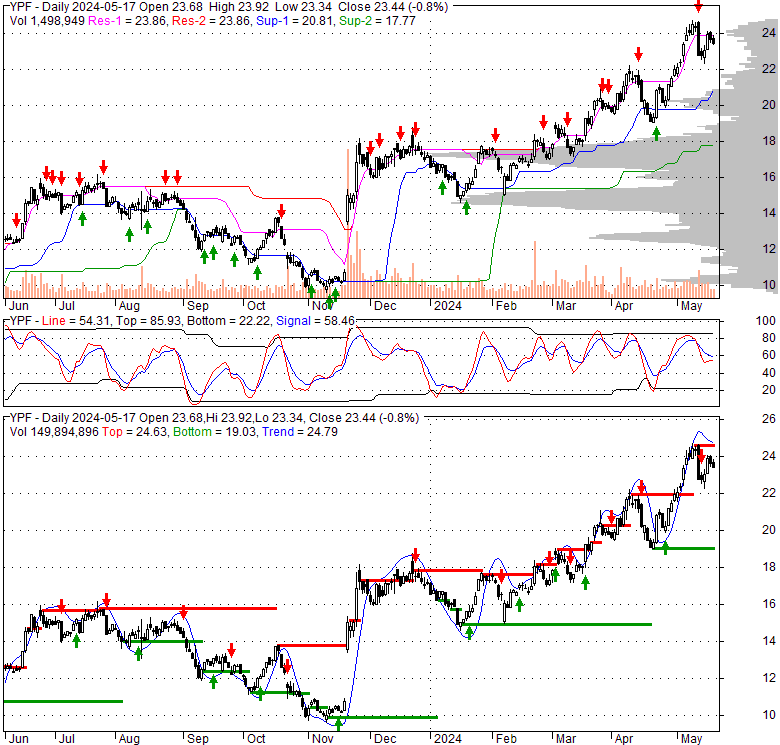
| Targets | 6-month : | 23.94 | 1-year : | 26.01 |
| Resists | First : | 20.5 | Second : | 22.27 |
| Pivot price | 20.49 |
|||
| Supports | First : | 17.63 | Second : | 14.67 |
| MAs | MA(5) : | 19.66 |
MA(20) : | 20.39 |
| MA(100) : | 17.76 |
MA(250) : | 14.83 |
|
| MACD | MACD : | 0.2 |
Signal : | 0.5 |
| %K %D | K(14,3) : | 4.3 |
D(3) : | 11.4 |
| RSI | RSI(14): 45.5 |
|||
| 52-week | High : | 22.27 | Low : | 9.56 |
Price has closed below its short-term moving average. Short-term moving average is currently above mid-term; and above long-term moving average. From the relationship between price and moving averages: This stock is NEUTRAL in short-term; and BULLISH in mid-long term.[ YPF ] has closed above bottom band by 17.2%. Bollinger Bands are 4.7% wider than normal. The current width of the bands does not suggest anything about the future direction or movement of prices.
| If tomorrow: | Open lower | Open higher |
| High: | 19.61 - 19.72 | 19.72 - 19.82 |
| Low: | 18.74 - 18.88 | 18.88 - 19.02 |
| Close: | 19.13 - 19.34 | 19.34 - 19.53 |
YPF Sociedad Anónima, an energy company, engages in the oil and gas upstream and downstream activities in Argentina. The company's upstream operations include the exploration, development, and production of crude oil, natural gas, and NGLs. Its downstream operations include the refining, marketing, transportation, and distribution of oil, petroleum products, petroleum derivatives, petrochemicals, LPG, and bio-fuels, as well as in gas separation, natural gas distribution operations, and power generation. As of December 31, 2021, it had interests in 119 oil and gas fields; approximately 643 million barrels (mmbbl) of oil; and approximately 2,447 billion cubic feet (bcf) of gas. It also had a retail distribution network of 1,654 YPF-branded service stations; and 18 exploration permits. In addition, the company owns and operates three refineries with combined annual refining capacity of approximately 120 mmbbl; approximately 2,800 kilometers of crude oil pipelines with approximately 640,000 barrels of aggregate daily transportation capacity of refined products; and crude oil tankage of approximately 7 mmbbl, as well as maintains terminal facilities at five Argentine ports. Further, it participates in 21 power generation plants with an aggregate installed capacity of 3,091 megawatts; offers diesel, fertilizers, lubricants, phytosanitary products, and ensiling bags; and supplies diesel, gasoline, fuel oil, coal, asphalts, paraffin, and sulfur, CO2, decanted oil, and aromatic extract. The company was founded in 1977 and is headquartered in Buenos Aires, Argentina.
Thu, 18 Apr 2024
The Goldman Sachs Group Increases YPF Sociedad Anónima (NYSE:YPF) Price Target to $20.00 - MarketBeat
Wed, 17 Apr 2024
YPF call volume above normal and directionally bullish - TipRanks.com - TipRanks
Wed, 17 Apr 2024
YPF Sociedad Anónima (NYSE:YPF) Downgraded to "Neutral" at Citigroup - MarketBeat
Tue, 16 Apr 2024
StockNews.com Lowers YPF Sociedad Anónima (NYSE:YPF) to Hold - MarketBeat
Tue, 16 Apr 2024
YPF Sociedad Anonima (YPF) is a Great Momentum Stock: Should You Buy? - Yahoo Canada Finance
Tue, 16 Apr 2024
YPF Sociedad Anonima (YPF) is a Great Momentum Stock: Should You Buy? - Yahoo Finance
| Price to Book Value: P/BV, a ratio used to compare book value to its current market price, to gauge whether a stock is valued properly. |
Underperform |
| Price to Earnings: PE, the ratio for valuing a company that measures its current share price relative to its earnings per share (EPS). |
Outperform |
| Discounted cash flow: DCF, a valuation method used to estimate the value of an investment based on its expected future cash flows. |
Outperform |
| Return on Assets: ROA, indicates how profitable a company is in relation to its total assets, how efficiently uses assets to generate a profit. |
Outperform |
| Return on Equity: ROE, a measure of financial performance calculated by dividing net income by equity. a gauge of profitability and efficiency. |
Outperform |
| Debt to Equity: evaluate financial leverage, reflects the ability of equity to cover outstanding debts in the event of a business downturn. |
Outperform |
|
Exchange:
NYSE
|
|
|
Sector:
Energy
|
|
|
Industry:
Oil & Gas Integrated
|
|
| Shares Out | 393 (M) |
| Shares Float | 193 (M) |
| Held by Insiders | 0 (%) |
| Held by Institutions | 11.8 (%) |
| Shares Short | 2,850 (K) |
| Shares Short P.Month | 1,660 (K) |
| EPS | -3.35 |
| EPS Est Next Qtrly | 0 |
| EPS Est This Year | 0 |
| EPS Est Next Year | 0 |
| Book Value (p.s.) | 22.75 |
| Profit Margin | -7.6 % |
| Operating Margin | 7.3 % |
| Return on Assets (ttm) | 2.6 % |
| Return on Equity (ttm) | -13.1 % |
| Qtrly Rev. Growth | 47.7 % |
| Gross Profit (p.s.) | 0 |
| Sales Per Share | 44.01 |
| EBITDA (p.s.) | 10.47 |
| Qtrly Earnings Growth | 0 % |
| Operating Cash Flow | 5,910 (M) |
| Levered Free Cash Flow | -1,490 (M) |
| PE Ratio | -5.78 |
| PEG Ratio | -0.6 |
| Price to Book value | 0.85 |
| Price to Sales | 0.43 |
| Price to Cash Flow | 1.28 |
| Dividend | 0 |
| Forward Dividend | 0 |
| Dividend Yield | 0% |
| Dividend Pay Date | Invalid DateTime. |
| Ex-Dividend Date | Invalid DateTime. |

|

|
|

|
|
|
|
|
|