
| 22.5523 0 (0%) | 11-13 09:46 | |||||||||||||
|
|
| Short term |  |
|||
| Mid term |  |
|||
| Targets | 6-month : | 28.01  |
1-year : | 30.99 |
| Resists | First : | 23.98 |
Second : | 26.54 |
| Pivot price | 22.51  |
|||
| Supports | First : | 19.85 | Second : | 16.51 |
| MAs | MA(5) : | 22.43 |
MA(20) : | 22.7 |
| MA(100) : | 0 | MA(250) : | 0 | |
| MACD | MACD : | -0.9 |
Signal : | -1 |
| %K %D | K(14,3) : | 63.2 |
D(3) : | 59.3 |
| RSI | RSI(14): 45.1 | |||
| 52-week | High : | 28.87 | Low : | 19.85 |
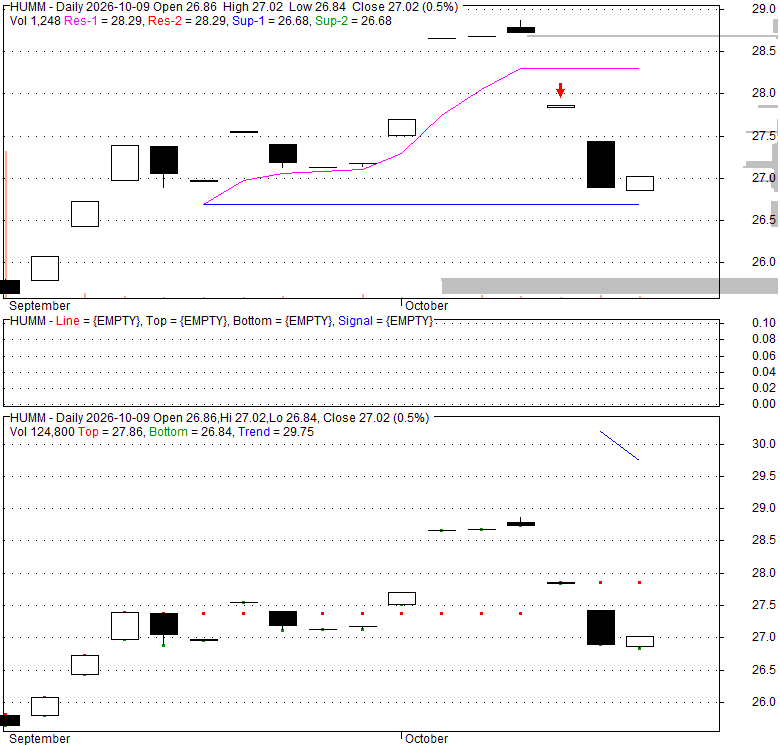
Price has closed above its short-term moving average. Short-term moving average is currently below mid-term; and below long-term moving average. From the relationship between price and moving averages: This stock is NEUTRAL in short-term; and NEUTRAL in mid-long term.[ HUMM ] has closed below upper band by 49.2%. Bollinger Bands are 0% narrower than normal.
| If tomorrow: | Open lower | Open higher |
| High: | 22.57 - 22.68 | 22.68 - 22.78 |
| Low: | 22.28 - 22.41 | 22.41 - 22.53 |
| Close: | 22.36 - 22.56 | 22.56 - 22.73 |
800VDC AI Datacenter Ecosystem ETF is an actively managed exchange-traded fund that seeks investment exposure to companies most directly linked to the 800VDC datacenter power ecosystem. The fund focuses on companies involved in power generation, electrical infrastructure, power distribution, data center systems, and related technologies supporting the transition to 800VDC power architectures for next-generation AI data centers.
Wed, 11 Nov 2026
HUMM Latest News and Headlines - TradingView
Mon, 09 Nov 2026
Is the Future of Data Center ETFs at Stake as Democrats Win Congress? - TradingView
Thu, 15 Oct 2026
HUMM | 800VDC AI Datacenter Ecosystem Stock Data, Price & News - Quiver Quantitative
Thu, 08 Oct 2026
AI ETFs: Beyond Chips & Hyperscalers - ETF Database
Sat, 03 Oct 2026
800VDC AI Datacenter Ecosystem ETF (HUMM) Stock Price, News & Analysis - 24/7 Wall St.
Sat, 03 Oct 2026
A Fund Manager Says the Old Market Indicators Broke in November 2022. His Firm Just Launched ETFs for the New Ones - 24/7 Wall St.
| Price to Book Value: P/BV, a ratio used to compare book value to its current market price, to gauge whether a stock is valued properly. |
Neutral |
| Price to Earnings: PE, the ratio for valuing a company that measures its current share price relative to its earnings per share (EPS). |
Neutral |
| Discounted cash flow: DCF, a valuation method used to estimate the value of an investment based on its expected future cash flows. |
Neutral |
| Return on Assets: ROA, indicates how profitable a company is in relation to its total assets, how efficiently uses assets to generate a profit. |
Neutral |
| Return on Equity: ROE, a measure of financial performance calculated by dividing net income by equity. a gauge of profitability and efficiency. |
Neutral |
| Debt to Equity: evaluate financial leverage, reflects the ability of equity to cover outstanding debts in the event of a business downturn. |
Neutral |
|
Exchange:
AMEX
|
|
|
Sector:
Financial Services
|
|
|
Industry:
Asset Management
|
|
| Shares Out | 0 (M) |
| Shares Float | 0 (M) |
| Held by Insiders | 0 (%) |
| Held by Institutions | 0 (%) |
| Shares Short | 0 (K) |
| Shares Short P.Month | 0 (K) |
| EPS | 0 |
| EPS Est Next Qtrly | 0 |
| EPS Est This Year | 0 |
| EPS Est Next Year | 0 |
| Book Value (p.s.) | 0 |
| Profit Margin | 0 % |
| Operating Margin | 0 % |
| Return on Assets (ttm) | 0 % |
| Return on Equity (ttm) | 0 % |
| Qtrly Rev. Growth | 0 % |
| Gross Profit (p.s.) | 0 |
| Sales Per Share | 0 |
| EBITDA (p.s.) | 0 |
| Qtrly Earnings Growth | 0 % |
| Operating Cash Flow | 0 (M) |
| Levered Free Cash Flow | 0 (M) |
| PE Ratio | 0 |
| PEG Ratio | 0 |
| Price to Book value | 0 |
| Price to Sales | 0 |
| Price to Cash Flow | 0 |
| Dividend | 0 |
| Forward Dividend | 0 |
| Dividend Yield | 0% |
| Dividend Pay Date | Invalid DateTime. |
| Ex-Dividend Date | Invalid DateTime. |

|

|

|

|
|
|
|
|
|