| 28.26 1.18 (4.36%) | 11-02 16:00 | |||||||||||||
|
|
| Short term | ||||
| Mid term | ||||
| Targets | 6-month : | 34.78 | 1-year : | 40.62 |
| Resists | First : | 29.78 | Second : | 34.78 |
| Pivot price | 28.14 |
|||
| Supports | First : | 27.87 | Second : | 26.69 |
| MAs | MA(5) : | 27.63 |
MA(20) : | 28.42 |
| MA(100) : | 27.97 |
MA(250) : | 26.89 |
|
| MACD | MACD : | -0.3 |
Signal : | -0.3 |
| %K %D | K(14,3) : | 40.5 |
D(3) : | 27.9 |
| RSI | RSI(14): 50 | |||
| 52-week | High : | 30.15 | Low : | 22.11 |
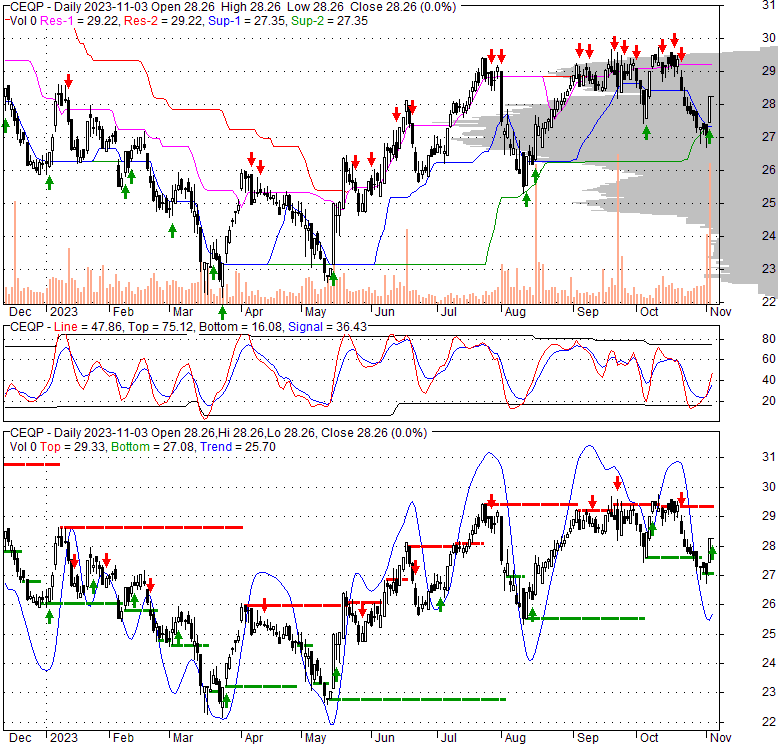
Price has closed above its short-term moving average. Short-term moving average is currently below mid-term; and below long-term moving average. From the relationship between price and moving averages: This stock is NEUTRAL in short-term; and NEUTRAL in mid-long term.[ CEQP ] has closed below upper band by 46.2%. Bollinger Bands are 22% wider than normal. The current width of the bands does not suggest anything about the future direction or movement of prices.
| If tomorrow: | Open lower | Open higher |
| High: | 28.3 - 28.43 | 28.43 - 28.57 |
| Low: | 27.84 - 28.02 | 28.02 - 28.2 |
| Close: | 27.93 - 28.21 | 28.21 - 28.49 |
Crestwood Equity Partners LP develops, acquires, owns, controls, and operates assets and operations in the energy midstream sector in the United States. It operates through three segments: Gathering and Processing North; Gathering and Processing South; and Storage and Logistics. The Gathering and Processing North segment offers natural gas, crude oil, and produced water gathering, compression, treating, processing, and disposal services to producers in the Williston Basin and Powder River Basin. This segment owns and operates natural gas facilities with approximately 0.4 Bcf/d of gathering capacity and 0.5 Bcf/d of processing capacity; crude oil facilities with approximately 150,000 Bbls/d of gathering capacity and 266,000 Bbls of storage capacity; and produced water facilities with approximately 130,000 Bbls/d of gathering and disposal capacity. The Gathering and Processing South segment provides natural gas gathering, compression, treating, and processing; and produced water gathering and disposal services to producers in the Marcellus, Barnett, and Delaware basins. This segment owns and operates natural gas facilities with 2.5 Bcf/d of gathering capacity and 0.7 Bcf/d of processing capacity; and produced water facilities with approximately 75,000 Bbls/d of gathering and disposal capacity. The Storage and Logistics segment offers natural gas liquids, crude oil, and natural gas storage, terminal, marketing, and transportation, including rail, truck and pipeline services to producers, refiners, marketers, utilities, and other customers. Crestwood Equity GP LLC serves as the general partner of Crestwood Equity Partners LP. The company was formerly known as Inergy L.P. and changed its name to Crestwood Equity Partners LP in October 2013. Crestwood Equity Partners LP was incorporated in 2001 and is headquartered in Houston, Texas.
Fri, 26 Apr 2024
Crestwood Equity Partners LP (CEQP) Up 4.5% Since Last Earnings Report: Can It Continue? - Yahoo Movies Canada
Wed, 14 Feb 2024
Investor Relations - Presentations & Webcasts
Mon, 18 Dec 2023
Year in Review: Energy Transfer acquiring Crestwood was a Deal of the Week - Houston Business Journal - The Business Journals
Wed, 01 Nov 2023
Are Investors Undervaluing Crestwood Equity Partners (CEQP) Right Now? - Yahoo Finance
Wed, 01 Nov 2023
Energy Transfer and Crestwood Announce Preliminary Election Results of Crestwood Preferred Unitholders - Business Wire
Fri, 13 Oct 2023
Why Crestwood Equity Partners LP (CEQP) is a Top Momentum Stock for the Long-Term - Yahoo Finance
| Price to Book Value: P/BV, a ratio used to compare book value to its current market price, to gauge whether a stock is valued properly. |
Outperform |
| Price to Earnings: PE, the ratio for valuing a company that measures its current share price relative to its earnings per share (EPS). |
Underperform |
| Discounted cash flow: DCF, a valuation method used to estimate the value of an investment based on its expected future cash flows. |
Outperform |
| Return on Assets: ROA, indicates how profitable a company is in relation to its total assets, how efficiently uses assets to generate a profit. |
Neutral |
| Return on Equity: ROE, a measure of financial performance calculated by dividing net income by equity. a gauge of profitability and efficiency. |
Underperform |
| Debt to Equity: evaluate financial leverage, reflects the ability of equity to cover outstanding debts in the event of a business downturn. |
Outperform |
|
Exchange:
NYSE
|
|
|
Sector:
Energy
|
|
|
Industry:
Oil & Gas Midstream
|
|
| Shares Out | 105 (M) |
| Shares Float | 83 (M) |
| Held by Insiders | 10.8 (%) |
| Held by Institutions | 53.1 (%) |
| Shares Short | 1,490 (K) |
| Shares Short P.Month | 1,590 (K) |
| EPS | 1.28 |
| EPS Est Next Qtrly | 0 |
| EPS Est This Year | 0 |
| EPS Est Next Year | 0 |
| Book Value (p.s.) | 11.46 |
| Profit Margin | 4 % |
| Operating Margin | 6.1 % |
| Return on Assets (ttm) | 3.4 % |
| Return on Equity (ttm) | 11.1 % |
| Qtrly Rev. Growth | -27.3 % |
| Gross Profit (p.s.) | 9.51 |
| Sales Per Share | 45.95 |
| EBITDA (p.s.) | 6.57 |
| Qtrly Earnings Growth | 0 % |
| Operating Cash Flow | 540 (M) |
| Levered Free Cash Flow | 415 (M) |
| PE Ratio | 21.9 |
| PEG Ratio | 3.2 |
| Price to Book value | 2.46 |
| Price to Sales | 0.61 |
| Price to Cash Flow | 5.49 |
| Dividend | 0 |
| Forward Dividend | 0 |
| Dividend Yield | 0% |
| Dividend Pay Date | Invalid DateTime. |
| Ex-Dividend Date | Invalid DateTime. |

|

|
|

|
|
|
|
|
|