| 26.19 0.13 (0.5%) | 05-07 16:00 | |||||||||||||
|
|
| Short term | |
|||
| Mid term | ||||
| Targets | 6-month : | 31.22 | 1-year : | 33.19 |
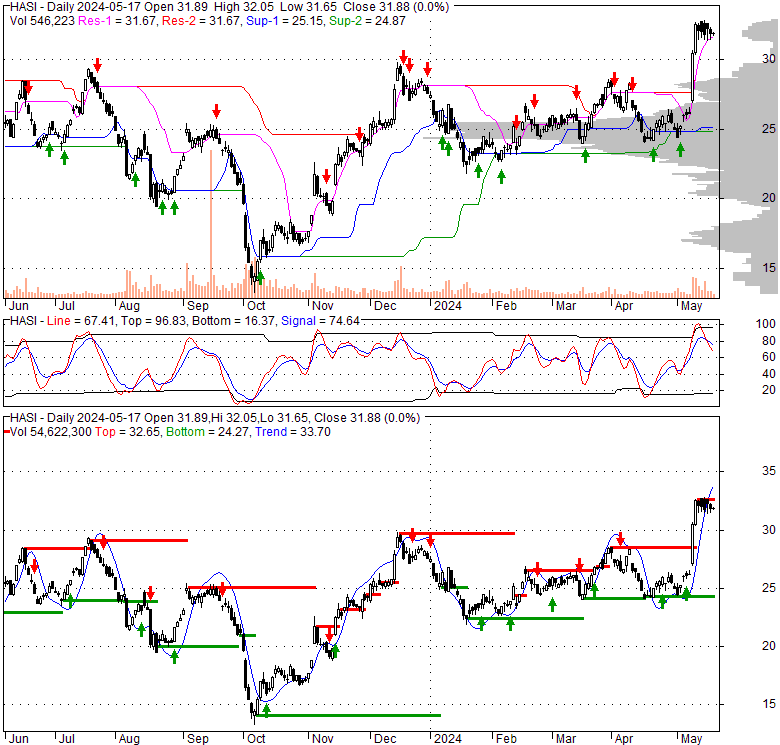
| Resists | First : | 26.73 | Second : | 28.42 |
| Pivot price | 25.36 |
|||
| Supports | First : | 24 | Second : | 19.96 |
| MAs | MA(5) : | 25.57 |
MA(20) : | 25.39 |
| MA(100) : | 25.62 |
MA(250) : | 24.07 |
|
| MACD | MACD : | -0.1 |
Signal : | -0.2 |
| %K %D | K(14,3) : | 81.5 |
D(3) : | 66.7 |
| RSI | RSI(14): 53.7 |
|||
| 52-week | High : | 29.87 | Low : | 13.22 |
Price has closed above its short-term moving average. Short-term moving average is currently below mid-term; and below long-term moving average. From the relationship between price and moving averages: This stock is NEUTRAL in short-term; and NEUTRAL in mid-long term.[ HASI ] has closed below upper band by 15.7%. Bollinger Bands are 38.1% narrower than normal. The current width of the bands does not suggest anything about the future direction or movement of prices.
| If tomorrow: | Open lower | Open higher |
| High: | 26.64 - 26.74 | 26.74 - 26.82 |
| Low: | 25.8 - 25.92 | 25.92 - 26.03 |
| Close: | 26 - 26.17 | 26.17 - 26.32 |
Hannon Armstrong Sustainable Infrastructure Capital, Inc. provides capital and services to the energy efficiency, renewable energy, and other sustainable infrastructure markets in the United States. The company's projects include building or facility that reduce energy usage or cost through the use of solar generation and energy storage or energy efficiency improvements, including heating, ventilation, and air conditioning systems (HVAC), as well as lighting, energy controls, roofs, windows, building shells, and/or combined heat and power systems. It also focuses in the areas of grid connected projects that deploy cleaner energy sources, such as solar and wind to generate power; and other sustainable infrastructure projects, including upgraded transmission or distribution systems, water and storm water infrastructures, and other projects. The company qualifies as a real estate investment trust for U.S. federal income tax purposes. It generally would not be subject to federal corporate income taxes if it distributes at least 90% of its taxable income to its stockholders. The company was founded in 1981 and is headquartered in Annapolis, Maryland.
Tue, 07 May 2024
Hannon Armstrong Sustainable Infrastructure Capital Inc (HASI) Q1 2024 Earnings: Surpasses ... - Yahoo Finance
Tue, 07 May 2024
Hannon Armstrong Q1 earnings, revenue buoyed by strong investment volumes (NYSE:HASI) - Seeking Alpha
Tue, 07 May 2024
HASI Announces First Quarter 2024 Results, Establishes $2b Strategic Partnership with KKR - Business Wire
Tue, 07 May 2024
HASI and KKR Establish $2 Billion Strategic Partnership to Invest in Sustainable Infrastructure Projects - Business Wire
Tue, 07 May 2024
New Forecasts: Here's What Analysts Think The Future Holds For Hannon Armstrong Sustainable Infrastructure Capital ... - Yahoo Lifestyle UK
Mon, 06 May 2024
Russell Investments Group Ltd. Sells 7347 Shares of Hannon Armstrong Sustainable Infrastructure Capital, Inc. (NYSE ... - Defense World
| Price to Book Value: P/BV, a ratio used to compare book value to its current market price, to gauge whether a stock is valued properly. |
Outperform |
| Price to Earnings: PE, the ratio for valuing a company that measures its current share price relative to its earnings per share (EPS). |
Neutral |
| Discounted cash flow: DCF, a valuation method used to estimate the value of an investment based on its expected future cash flows. |
Neutral |
| Return on Assets: ROA, indicates how profitable a company is in relation to its total assets, how efficiently uses assets to generate a profit. |
Outperform |
| Return on Equity: ROE, a measure of financial performance calculated by dividing net income by equity. a gauge of profitability and efficiency. |
Outperform |
| Debt to Equity: evaluate financial leverage, reflects the ability of equity to cover outstanding debts in the event of a business downturn. |
Underperform |
|
Exchange:
NYSE
|
|
|
Sector:
Real Estate
|
|
|
Industry:
REIT - Specialty
|
|
| Shares Out | 113 (M) |
| Shares Float | 110 (M) |
| Held by Insiders | 2.4 (%) |
| Held by Institutions | 110.4 (%) |
| Shares Short | 14,880 (K) |
| Shares Short P.Month | 14,840 (K) |
| EPS | 1.41 |
| EPS Est Next Qtrly | 0 |
| EPS Est This Year | 0 |
| EPS Est Next Year | 0 |
| Book Value (p.s.) | 18.67 |
| Profit Margin | 108.6 % |
| Operating Margin | 39.2 % |
| Return on Assets (ttm) | 2.6 % |
| Return on Equity (ttm) | 7.9 % |
| Qtrly Rev. Growth | 72.8 % |
| Gross Profit (p.s.) | 0 |
| Sales Per Share | 1.2 |
| EBITDA (p.s.) | 0 |
| Qtrly Earnings Growth | 0 % |
| Operating Cash Flow | 100 (M) |
| Levered Free Cash Flow | 0 (M) |
| PE Ratio | 18.44 |
| PEG Ratio | 1.2 |
| Price to Book value | 1.4 |
| Price to Sales | 21.68 |
| Price to Cash Flow | 29.8 |
| Dividend | 0 |
| Forward Dividend | 0 |
| Dividend Yield | 0% |
| Dividend Pay Date | Invalid DateTime. |
| Ex-Dividend Date | Invalid DateTime. |

|

|
|

|
|
|
|
|
|