| 0 (0%) | 06-28 18:07 | |||||||||||||
|
|
| Short term | ||||
| Mid term | ||||
| Targets | 6-month : | 52.64 | 1-year : | 61.48 |
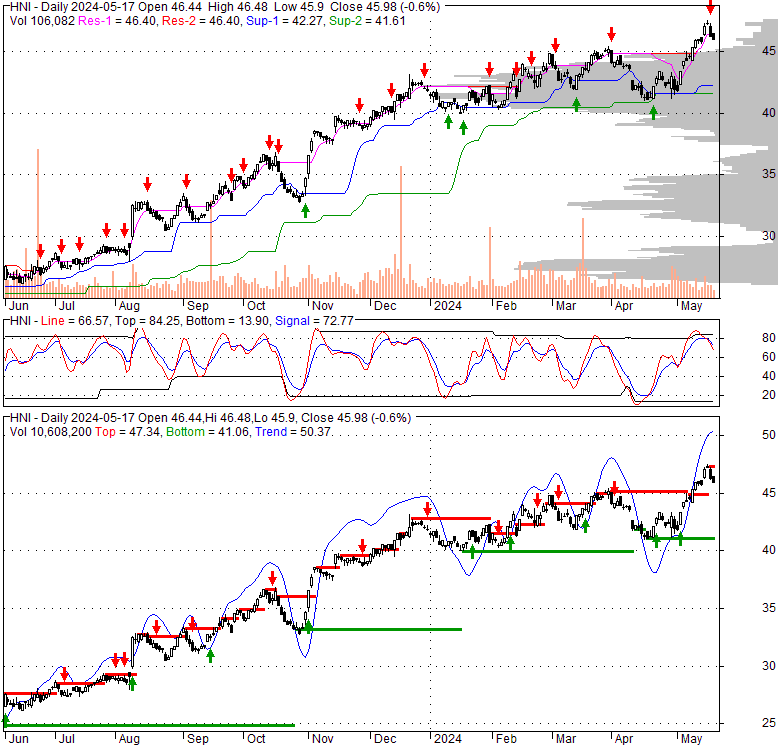
| Resists | First : | 45.06 | Second : | 52.64 |
| Pivot price | 42.76 |
|||
| Supports | First : | 42.51 | Second : | 40.93 |
| MAs | MA(5) : | 43.66 |
MA(20) : | 42.52 |
| MA(100) : | 42.46 |
MA(250) : | 36.2 |
|
| MACD | MACD : | 0.1 |
Signal : | -0.1 |
| %K %D | K(14,3) : | 89.2 |
D(3) : | 86.1 |
| RSI | RSI(14): 61.7 |
|||
| 52-week | High : | 45.47 | Low : | 25.05 |
Price has closed above its short-term moving average. Short-term moving average is currently above mid-term; and above long-term moving average. From the relationship between price and moving averages: This stock is BULLISH in short-term; and BULLISH in mid-long term.[ HNI ] has closed below upper band by 4.7%. Bollinger Bands are 36.2% wider than normal. The current width of the bands does not suggest anything about the future direction or movement of prices.
| If tomorrow: | Open lower | Open higher |
| High: | 44.86 - 45.02 | 45.02 - 45.16 |
| Low: | 43.9 - 44.1 | 44.1 - 44.29 |
| Close: | 44.31 - 44.59 | 44.59 - 44.85 |
Mon, 06 May 2024
QVC Snaps Up Competitor HSN - Yahoo Movies UK
Fri, 03 May 2024
HSNI to Host Color of Ultimate Showcase on June 7 - Ultiworld
Thu, 02 May 2024
Road to HSNI: How to Watch Neuqua Knockout, Amherst Invite, and Spaghetti Western - Ultiworld
Mon, 15 Apr 2024
65 years completing families: Humane Society of North Iowa - Globe Gazette
Thu, 14 Mar 2024
Road to HSNI: Livestreams from High School Qualifiers, How to Watch - Ultiworld
Wed, 03 Jan 2024
Announcing the 2024 High School National Invite - Ultiworld
| Price to Book Value: P/BV, a ratio used to compare book value to its current market price, to gauge whether a stock is valued properly. |
Neutral |
| Price to Earnings: PE, the ratio for valuing a company that measures its current share price relative to its earnings per share (EPS). |
Neutral |
| Discounted cash flow: DCF, a valuation method used to estimate the value of an investment based on its expected future cash flows. |
Neutral |
| Return on Assets: ROA, indicates how profitable a company is in relation to its total assets, how efficiently uses assets to generate a profit. |
Neutral |
| Return on Equity: ROE, a measure of financial performance calculated by dividing net income by equity. a gauge of profitability and efficiency. |
Neutral |
| Debt to Equity: evaluate financial leverage, reflects the ability of equity to cover outstanding debts in the event of a business downturn. |
Neutral |
|
Exchange:
|
|
|
Sector:
|
|
|
Industry:
|
|
| Shares Out | 47 (M) |
| Shares Float | 46 (M) |
| Held by Insiders | 1.8 (%) |
| Held by Institutions | 79.5 (%) |
| Shares Short | 549 (K) |
| Shares Short P.Month | 627 (K) |
| EPS | 1.41 |
| EPS Est Next Qtrly | 0 |
| EPS Est This Year | 0 |
| EPS Est Next Year | 0 |
| Book Value (p.s.) | 16.3 |
| Profit Margin | 2.5 % |
| Operating Margin | 5 % |
| Return on Assets (ttm) | 7.4 % |
| Return on Equity (ttm) | 9.4 % |
| Qtrly Rev. Growth | 22.7 % |
| Gross Profit (p.s.) | 0 |
| Sales Per Share | 53.69 |
| EBITDA (p.s.) | 5.86 |
| Qtrly Earnings Growth | 859.7 % |
| Operating Cash Flow | 246 (M) |
| Levered Free Cash Flow | 129 (M) |
| PE Ratio | 31.42 |
| PEG Ratio | 1.4 |
| Price to Book value | 2.73 |
| Price to Sales | 0.83 |
| Price to Cash Flow | 8.58 |
| Dividend | 0 |
| Forward Dividend | 0 |
| Dividend Yield | 0% |
| Dividend Pay Date | Invalid DateTime. |
| Ex-Dividend Date | Invalid DateTime. |

|

|
|

|
|
|
|
|
|