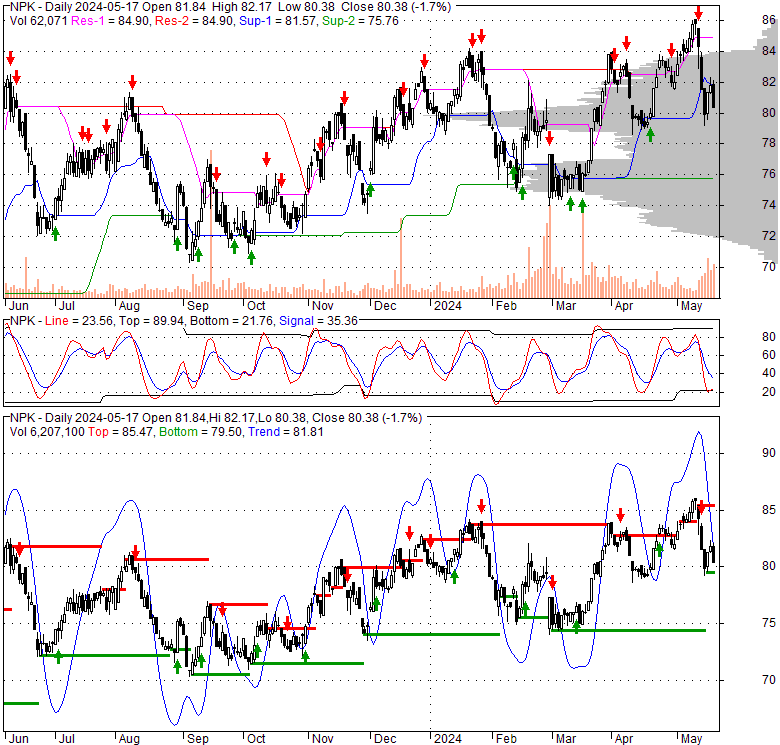
| 84.08 0.32 (0.38%) | 05-03 16:00 | |||||||||||||
|
|
| Short term | |
|||
| Mid term | ||||
| Targets | 6-month : | 99.08 |
1-year : | 115.72 |
| Resists | First : | 84.83 |
Second : | 99.08 |
| Pivot price | 81.96 |
|||
| Supports | First : | 80.96 |
Second : | 78.56 |
| MAs | MA(5) : | 82.99 |
MA(20) : | 81.59 |
| MA(100) : | 79.94 |
MA(250) : | 77.36 |
|
| MACD | MACD : | 0.9 |
Signal : | 0.8 |
| %K %D | K(14,3) : | 87.8 |
D(3) : | 79.6 |
| RSI | RSI(14): 64.9 |
|||
| 52-week | High : | 84.83 | Low : | 68.81 |
Price has closed above its short-term moving average. Short-term moving average is currently above mid-term; and above long-term moving average. From the relationship between price and moving averages: This stock is BULLISH in short-term; and NEUTRAL in mid-long term.[ NPK ] has closed below upper band by 18.0%. Bollinger Bands are 1.8% wider than normal. The current width of the bands does not suggest anything about the future direction or movement of prices.
| If tomorrow: | Open lower | Open higher |
| High: | 84.96 - 85.3 | 85.3 - 85.65 |
| Low: | 82.5 - 82.86 | 82.86 - 83.23 |
| Close: | 83.5 - 84.11 | 84.11 - 84.75 |
National Presto Industries Inc. provides housewares and small electric appliance, and defense products primarily in North America. It operates through three segments: Housewares/Small Appliance, Defense, and Safety. The company's Housewares/Small Appliance segment designs, markets, and distributes housewares and small electrical appliances, including pressure cookers and canners; heat control single thermostatic control line of skillets, griddles, woks, and multi-purpose cookers; slow cookers; deep fryers; air fryers; waffle makers; pizza ovens; slicer/shredders; electric heaters; hot air, oil, and microwave corn poppers; dehydrators; rice cookers; microwave bacon cookers; egg cookers; coffeemakers and coffeemaker accessories; electric tea kettles; electric knife sharpeners; various kitchen gadgets; and timers under the Presto Control Master brand. This segment sells its products directly to retailers, as well as through independent distributors. The Defense segment manufactures and sells 40mm ammunition, precision mechanical and electro-mechanical products, and medium caliber cartridge cases; and detonators, booster pellets, release cartridges, lead azide, and other military energetic devices and materials. This segment primarily serves the United States Department of Defense (DOD) and DOD prime contractors. The Safety segment patents machine learning, digital sensors, and cloud-based technology to continuously monitor freezers and refrigerators detecting and alerting users to potential safety issues around pharmaceuticals and food. National Presto Industries Inc. was incorporated in 1905 and is based in Eau Claire, Wisconsin.
Fri, 03 May 2024
National Presto Industries (NYSE:NPK) Hits New 1-Year High at $84.83 - MarketBeat
Sun, 28 Apr 2024
Cwm LLC Trims Position in National Presto Industries, Inc. (NYSE:NPK) - Defense World
Sat, 27 Apr 2024
National Presto Industries, Inc. (NYSE:NPK) Sees Large Decrease in Short Interest - MarketBeat
Sat, 24 Feb 2024
Should Income Investors Look At National Presto Industries, Inc. (NYSE:NPK) Before Its Ex-Dividend? - Simply Wall St
Mon, 19 Feb 2024
MAS: Bullish Momentum: 3 Home Improvement Stocks to Watch - StockNews.com
Mon, 03 Apr 2023
National Presto Industries, Inc. announces defense contract option award - WEAU
| Price to Book Value: P/BV, a ratio used to compare book value to its current market price, to gauge whether a stock is valued properly. |
Neutral |
| Price to Earnings: PE, the ratio for valuing a company that measures its current share price relative to its earnings per share (EPS). |
Underperform |
| Discounted cash flow: DCF, a valuation method used to estimate the value of an investment based on its expected future cash flows. |
Outperform |
| Return on Assets: ROA, indicates how profitable a company is in relation to its total assets, how efficiently uses assets to generate a profit. |
Outperform |
| Return on Equity: ROE, a measure of financial performance calculated by dividing net income by equity. a gauge of profitability and efficiency. |
Outperform |
| Debt to Equity: evaluate financial leverage, reflects the ability of equity to cover outstanding debts in the event of a business downturn. |
Underperform |

|
Exchange:
NYSE
|
|
|
Sector:
Industrials
|
|
|
Industry:
Aerospace & Defense
|
|
| Shares Out | 7 (M) |
| Shares Float | 5 (M) |
| Held by Insiders | 28 (%) |
| Held by Institutions | 59.5 (%) |
| Shares Short | 100 (K) |
| Shares Short P.Month | 112 (K) |
| EPS | 4.86 |
| EPS Est Next Qtrly | 0 |
| EPS Est This Year | 0 |
| EPS Est Next Year | 0 |
| Book Value (p.s.) | 50.29 |
| Profit Margin | 10.1 % |
| Operating Margin | 13.5 % |
| Return on Assets (ttm) | 5.1 % |
| Return on Equity (ttm) | 9.8 % |
| Qtrly Rev. Growth | -13.7 % |
| Gross Profit (p.s.) | 0 |
| Sales Per Share | 47.88 |
| EBITDA (p.s.) | 5.76 |
| Qtrly Earnings Growth | 503.3 % |
| Operating Cash Flow | 45 (M) |
| Levered Free Cash Flow | 30 (M) |
| PE Ratio | 17.3 |
| PEG Ratio | 0 |
| Price to Book value | 1.67 |
| Price to Sales | 1.75 |
| Price to Cash Flow | 13.18 |
| Dividend | 0 |
| Forward Dividend | 0 |
| Dividend Yield | 0% |
| Dividend Pay Date | Invalid DateTime. |
| Ex-Dividend Date | Invalid DateTime. |