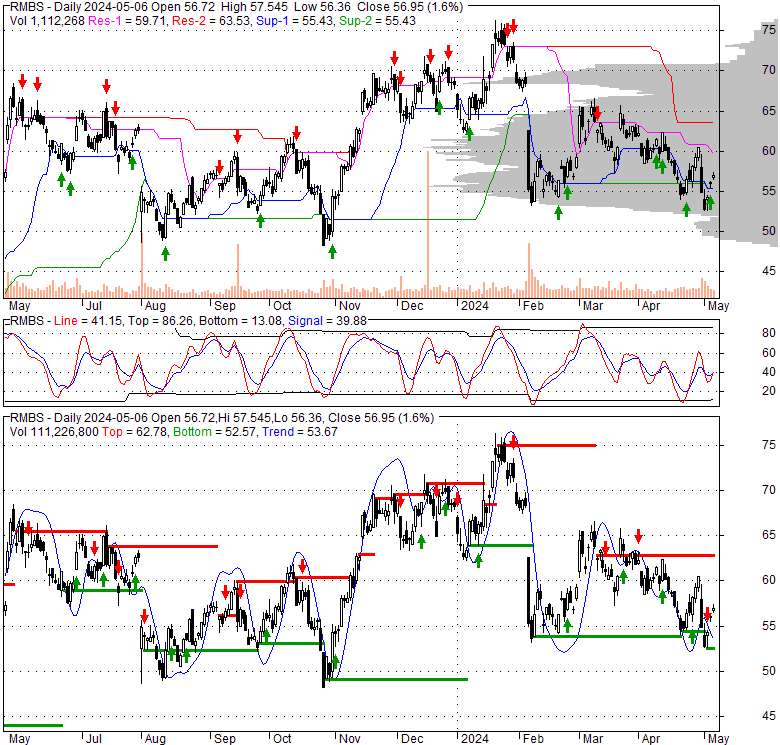
| 59.2 1.08 (1.86%) | 04-26 10:56 | |||||||||||||
|
|
| Short term | |
|||
| Mid term | |
|||
| Targets | 6-month : | 70.79 |
1-year : | 75.6 |
| Resists | First : | 60.6 |
Second : | 64.73 |
| Pivot price | 58.33 |
|||
| Supports | First : | 53.93 | Second : | 44.87 |
| MAs | MA(5) : | 56.97 |
MA(20) : | 58.79 |
| MA(100) : | 63.18 |
MA(250) : | 60.1 |
|
| MACD | MACD : | -1.1 |
Signal : | -1.1 |
| %K %D | K(14,3) : | 46.9 |
D(3) : | 35.6 |
| RSI | RSI(14): 50.1 |
|||
| 52-week | High : | 76.37 | Low : | 44.45 |
Price has closed above its short-term moving average. Short-term moving average is currently below mid-term; and below long-term moving average. From the relationship between price and moving averages: This stock is NEUTRAL in short-term; and BEARISH in mid-long term.[ RMBS ] has closed below upper band by 41.8%. Bollinger Bands are 17.4% narrower than normal. The current width of the bands does not suggest anything about the future direction or movement of prices.
| If tomorrow: | Open lower | Open higher |
| High: | 58.4 - 58.6 | 58.6 - 58.79 |
| Low: | 54.81 - 55.06 | 55.06 - 55.3 |
| Close: | 57.7 - 58.07 | 58.07 - 58.41 |
Rambus Inc. provides semiconductor products in the United States, Taiwan, South Korea, Japan, Europe, Canada, Singapore, China, and internationally. The company offers DDR memory interface chips, including DDR5, DDR4 and DDR3 memory interface chips to module manufacturers and OEMs; silicon IP comprising, interface and security IP solutions that move and protect data in advanced applications; and physical interface and digital controller IP to offer industry-leading, integrated memory and interconnect subsystems. It also provides a portfolio of patents that covers memory architecture, high-speed serial links, and security products. The company markets its products and services through its direct sales force and distributors. Rambus Inc. was incorporated in 1990 and is headquartered in San Jose, California.
Mon, 22 Apr 2024
Duality Advisers LP Invests $2.27 Million in Rambus Inc. (NASDAQ:RMBS) - MarketBeat
Fri, 19 Apr 2024
We Take A Look At Why Rambus Inc.'s (NASDAQ:RMBS) CEO Compensation Is Well Earned - Simply Wall St
Wed, 03 Apr 2024
Declining Stock and Solid Fundamentals: Is The Market Wrong About Rambus Inc. (NASDAQ:RMBS)? - Yahoo Finance
Mon, 01 Apr 2024
Rambus (RMBS) Advances While Market Declines: Some Information for Investors - Yahoo Finance
Thu, 14 Mar 2024
Investors Heavily Search Rambus, Inc. (RMBS): Here is What You Need to Know - Yahoo Finance
Tue, 12 Mar 2024
Rambus Inc (RMBS) CFO Desmond Lynch Sells 7,837 Shares - Yahoo Finance
| Price to Book Value: P/BV, a ratio used to compare book value to its current market price, to gauge whether a stock is valued properly. |
Outperform |
| Price to Earnings: PE, the ratio for valuing a company that measures its current share price relative to its earnings per share (EPS). |
Outperform |
| Discounted cash flow: DCF, a valuation method used to estimate the value of an investment based on its expected future cash flows. |
Outperform |
| Return on Assets: ROA, indicates how profitable a company is in relation to its total assets, how efficiently uses assets to generate a profit. |
Outperform |
| Return on Equity: ROE, a measure of financial performance calculated by dividing net income by equity. a gauge of profitability and efficiency. |
Outperform |
| Debt to Equity: evaluate financial leverage, reflects the ability of equity to cover outstanding debts in the event of a business downturn. |
Underperform |

|
Exchange:
NASDAQ
|
|
|
Sector:
Technology
|
|
|
Industry:
Semiconductors
|
|
| Shares Out | 109 (M) |
| Shares Float | 107 (M) |
| Held by Insiders | 0.6 (%) |
| Held by Institutions | 91.6 (%) |
| Shares Short | 3,070 (K) |
| Shares Short P.Month | 3,170 (K) |
| EPS | 3 |
| EPS Est Next Qtrly | 0 |
| EPS Est This Year | 0 |
| EPS Est Next Year | 0 |
| Book Value (p.s.) | 9.61 |
| Profit Margin | 72.4 % |
| Operating Margin | 29.6 % |
| Return on Assets (ttm) | 5 % |
| Return on Equity (ttm) | 36.7 % |
| Qtrly Rev. Growth | -0.2 % |
| Gross Profit (p.s.) | 0 |
| Sales Per Share | 4.24 |
| EBITDA (p.s.) | 1.28 |
| Qtrly Earnings Growth | 277.2 % |
| Operating Cash Flow | 196 (M) |
| Levered Free Cash Flow | 109 (M) |
| PE Ratio | 19.62 |
| PEG Ratio | 1.9 |
| Price to Book value | 6.13 |
| Price to Sales | 13.9 |
| Price to Cash Flow | 32.75 |
| Dividend | 0 |
| Forward Dividend | 0 |
| Dividend Yield | 0% |
| Dividend Pay Date | Invalid DateTime. |
| Ex-Dividend Date | Invalid DateTime. |