| 74.79 -0.21 (-0.28%) | 05-07 15:27 | |||||||||||||
|
|
| Short term | |
|||
| Mid term | |
|||
| Targets | 6-month : | 88.7 |
1-year : | 103.61 |
| Resists | First : | 75.94 |
Second : | 88.7 |
| Pivot price | 67.57 |
|||
| Supports | First : | 67.08 |
Second : | 61.61 |
| MAs | MA(5) : | 71.99 |
MA(20) : | 66.45 |
| MA(100) : | 57.49 |
MA(250) : | 46.64 |
|
| MACD | MACD : | 2.7 |
Signal : | 1.7 |
| %K %D | K(14,3) : | 95.6 |
D(3) : | 87.3 |
| RSI | RSI(14): 77.2 |
|||
| 52-week | High : | 75.94 | Low : | 32.11 |
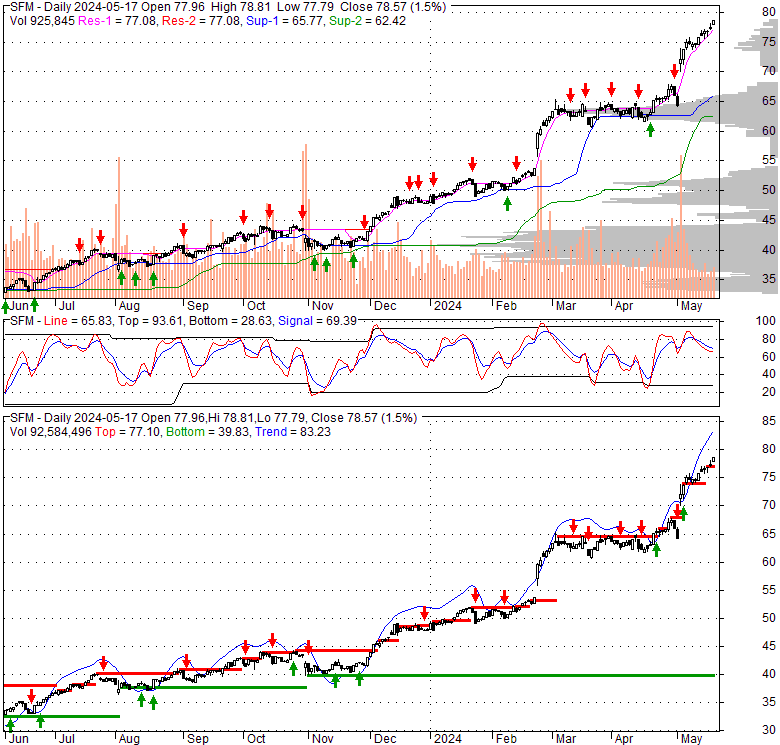
Price has closed above its short-term moving average. Short-term moving average is currently above mid-term; and above long-term moving average. From the relationship between price and moving averages: This stock is BULLISH in short-term; and BULLISH in mid-long term.[ SFM ] has closed below upper band by 4.3%. Bollinger Bands are 175.9% wider than normal. The large width of the bands suggest high volatility as compared to its normal range. The bands have been in this wide range for 3 days. This is a sign that the current trend might continue.
| If tomorrow: | Open lower | Open higher |
| High: | 75.65 - 75.95 | 75.95 - 76.27 |
| Low: | 72.83 - 73.14 | 73.14 - 73.46 |
| Close: | 74.48 - 75.03 | 75.03 - 75.6 |
Sprouts Farmers Market, Inc. offers fresh, natural, and organic food products in the United States. The company offers perishable product categories, including fresh produce, meat, seafood, deli, bakery, floral and dairy, and dairy alternatives; and non-perishable product categories, such as grocery, vitamins and supplements, bulk items, frozen foods, beer and wine, and natural health and body care. As of January 2, 2022, it operated 374 stores in 23 states. Sprouts Farmers Market, Inc. was founded in 2002 and is headquartered in Phoenix, Arizona.
Tue, 07 May 2024
Sprouts Farmers Market (NASDAQ:SFM) Reaches New 12-Month High at $75.36 - MarketBeat
Mon, 06 May 2024
Should Value Investors Buy Sprouts Farmers Market (SFM) Stock? - Yahoo Movies Canada
Mon, 06 May 2024
Here's Why Sprouts Farmers (SFM) is a Strong Growth Stock - Yahoo Finance
Mon, 06 May 2024
Top 2 Risk Off Stocks That May Plunge In Q2 - Sprouts Farmers Market (NASDAQ:SFM) - Benzinga
Sun, 05 May 2024
Why Sprouts Farmers (SFM) is a Top Value Stock for the Long-Term - Yahoo Singapore News
Sun, 05 May 2024
Sprouts Farmers Market, Inc. (NASDAQ:SFM) Q1 2024 Earnings Call Transcript - Insider Monkey
| Price to Book Value: P/BV, a ratio used to compare book value to its current market price, to gauge whether a stock is valued properly. |
Outperform |
| Price to Earnings: PE, the ratio for valuing a company that measures its current share price relative to its earnings per share (EPS). |
Outperform |
| Discounted cash flow: DCF, a valuation method used to estimate the value of an investment based on its expected future cash flows. |
Neutral |
| Return on Assets: ROA, indicates how profitable a company is in relation to its total assets, how efficiently uses assets to generate a profit. |
Outperform |
| Return on Equity: ROE, a measure of financial performance calculated by dividing net income by equity. a gauge of profitability and efficiency. |
Outperform |
| Debt to Equity: evaluate financial leverage, reflects the ability of equity to cover outstanding debts in the event of a business downturn. |
Outperform |
|
Exchange:
NASDAQ
|
|
|
Sector:
Consumer Defensive
|
|
|
Industry:
Grocery Stores
|
|
| Shares Out | 100 (M) |
| Shares Float | 100 (M) |
| Held by Insiders | 0.6 (%) |
| Held by Institutions | 117.8 (%) |
| Shares Short | 13,680 (K) |
| Shares Short P.Month | 14,590 (K) |
| EPS | 2.89 |
| EPS Est Next Qtrly | 0 |
| EPS Est This Year | 0 |
| EPS Est Next Year | 0 |
| Book Value (p.s.) | 12.01 |
| Profit Margin | 4.2 % |
| Operating Margin | 8.1 % |
| Return on Assets (ttm) | 7.6 % |
| Return on Equity (ttm) | 26.2 % |
| Qtrly Rev. Growth | 8.6 % |
| Gross Profit (p.s.) | 0 |
| Sales Per Share | 69.56 |
| EBITDA (p.s.) | 5.34 |
| Qtrly Earnings Growth | 53.4 % |
| Operating Cash Flow | 505 (M) |
| Levered Free Cash Flow | 346 (M) |
| PE Ratio | 25.96 |
| PEG Ratio | 2.7 |
| Price to Book value | 6.24 |
| Price to Sales | 1.07 |
| Price to Cash Flow | 14.92 |
| Dividend | 0 |
| Forward Dividend | 0 |
| Dividend Yield | 0% |
| Dividend Pay Date | Invalid DateTime. |
| Ex-Dividend Date | Invalid DateTime. |

|

|
|

|
|
|
|
|
|