| 0.3849 0.005 (1.29%) | 08-21 15:59 | |||||||||||||
|
|
| Short term | ||||
| Mid term | ||||
| Targets | 6-month : | 0.75 |
1-year : | 0.96 |
| Resists | First : | 0.65 |
Second : | 0.82 |
| Pivot price | 0.39 |
|||
| Supports | First : | 0.36 | Second : | 0.29 |
| MAs | MA(5) : | 0.37 | MA(20) : | 0.41 |
| MA(100) : | 1.37 |
MA(250) : | 3.98 |
|
| MACD | MACD : | -0.2 |
Signal : | -0.2 |
| %K %D | K(14,3) : | 14.3 |
D(3) : | 10.8 |
| RSI | RSI(14): 26.2 | |||
| 52-week | High : | 16 | Low : | 0.36 |
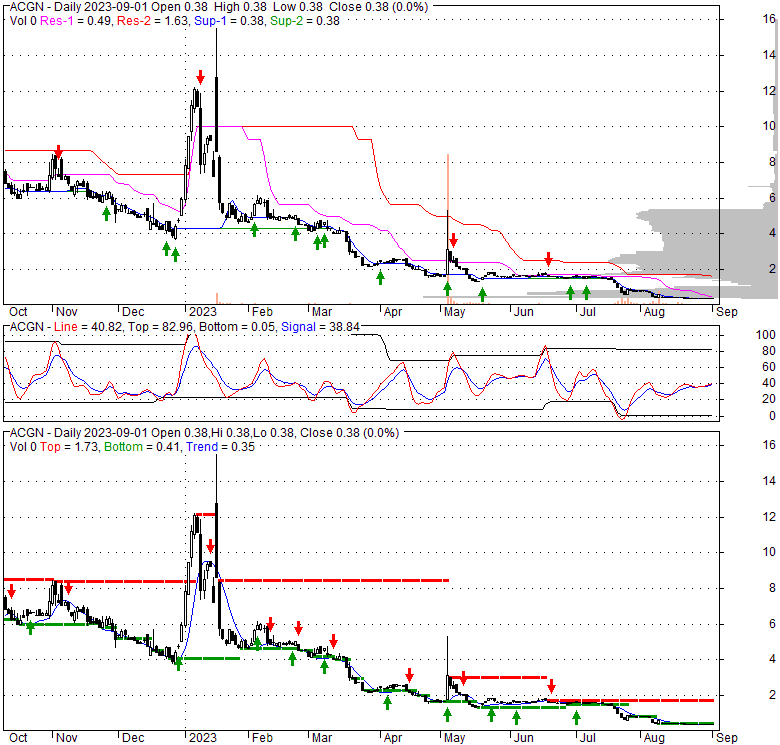
Price has closed below its short-term moving average. Short-term moving average is currently below mid-term; and below long-term moving average. From the relationship between price and moving averages: This stock is NEUTRAL in short-term; and BEARISH in mid-long term.[ ACGN ] has closed above bottom band by 32.2%. Bollinger Bands are 86.9% narrower than normal. The narrow width of the bands suggests low volatility as compared to its normal range. The bands have been in this narrow range for 8 bars. This is a sign that the market may be about to initiate a new trend.
| If tomorrow: | Open lower | Open higher |
| High: | 0.38 - 0.38 | 0.38 - 0.38 |
| Low: | 0.37 - 0.38 | 0.38 - 0.38 |
| Close: | 0.38 - 0.38 | 0.38 - 0.38 |
Aceragen, Inc., a clinical-stage biopharmaceutical company, focuses on the discovery, development, and commercialization of drugs for rare pulmonary and rheumatic diseases in the United States. Its clinical development pipeline includes ACG-701, which is in Phase 2 clinical trial for cystic fibrosis pulmonary exacerbations, as well as for melioidosis; and ACG-801 for farber disease. Aceragen, Inc. has a collaboration and option agreement with Scriptr Global, Inc. to identify, research, and develop gene therapy candidates for the treatment, palliation, diagnosis, or prevention of myotonic dystrophy type 1 and Friedreich's Ataxia. The company was formerly known as Idera Pharmaceuticals, Inc. and changed its name to Aceragen, Inc. in January 2023. Aceragen, Inc. was incorporated in 1989 and is headquartered in Exton, Pennsylvania.
Tue, 15 Aug 2023
Insider Sellers Might Regret Selling Aceragen Shares at a Lower Price Than Current Market Value - Simply Wall St
Mon, 07 Aug 2023
Why Kosmos Energy Shares Are Trading Higher; Here Are 20 Stocks Moving Premarket - AgriFORCE Growing Syst - Benzinga
Fri, 21 Jul 2023
Why Metropolitan Bank Holding Shares Are Trading Lower By 9%? Here Are Other Stocks Moving In Friday’s Mi - Benzinga
Wed, 12 Jul 2023
Aceragen plans to liquidate as cash runs low - The Business Journals
| Price to Book Value: P/BV, a ratio used to compare book value to its current market price, to gauge whether a stock is valued properly. |
Neutral |
| Price to Earnings: PE, the ratio for valuing a company that measures its current share price relative to its earnings per share (EPS). |
Neutral |
| Discounted cash flow: DCF, a valuation method used to estimate the value of an investment based on its expected future cash flows. |
Neutral |
| Return on Assets: ROA, indicates how profitable a company is in relation to its total assets, how efficiently uses assets to generate a profit. |
Neutral |
| Return on Equity: ROE, a measure of financial performance calculated by dividing net income by equity. a gauge of profitability and efficiency. |
Neutral |
| Debt to Equity: evaluate financial leverage, reflects the ability of equity to cover outstanding debts in the event of a business downturn. |
Neutral |
|
Exchange:
NASDAQ
|
|
|
Sector:
Healthcare
|
|
|
Industry:
Biotechnology
|
|
| Shares Out | 8 (M) |
| Shares Float | 3 (M) |
| Held by Insiders | 69.7 (%) |
| Held by Institutions | 2 (%) |
| Shares Short | 131 (K) |
| Shares Short P.Month | 96 (K) |
| EPS | -8.61 |
| EPS Est Next Qtrly | 0 |
| EPS Est This Year | 0 |
| EPS Est Next Year | 0 |
| Book Value (p.s.) | 2.7 |
| Profit Margin | 0 % |
| Operating Margin | -311 % |
| Return on Assets (ttm) | -26.3 % |
| Return on Equity (ttm) | -98.7 % |
| Qtrly Rev. Growth | 0 % |
| Gross Profit (p.s.) | 0 |
| Sales Per Share | 0.87 |
| EBITDA (p.s.) | -2.71 |
| Qtrly Earnings Growth | 0 % |
| Operating Cash Flow | -30 (M) |
| Levered Free Cash Flow | 0 (M) |
| PE Ratio | -0.05 |
| PEG Ratio | 0 |
| Price to Book value | 0.14 |
| Price to Sales | 0.43 |
| Price to Cash Flow | -0.11 |
| Dividend | 0 |
| Forward Dividend | 0 |
| Dividend Yield | 0% |
| Dividend Pay Date | Invalid DateTime. |
| Ex-Dividend Date | Invalid DateTime. |

|

|
|

|
|
|
|
|
|