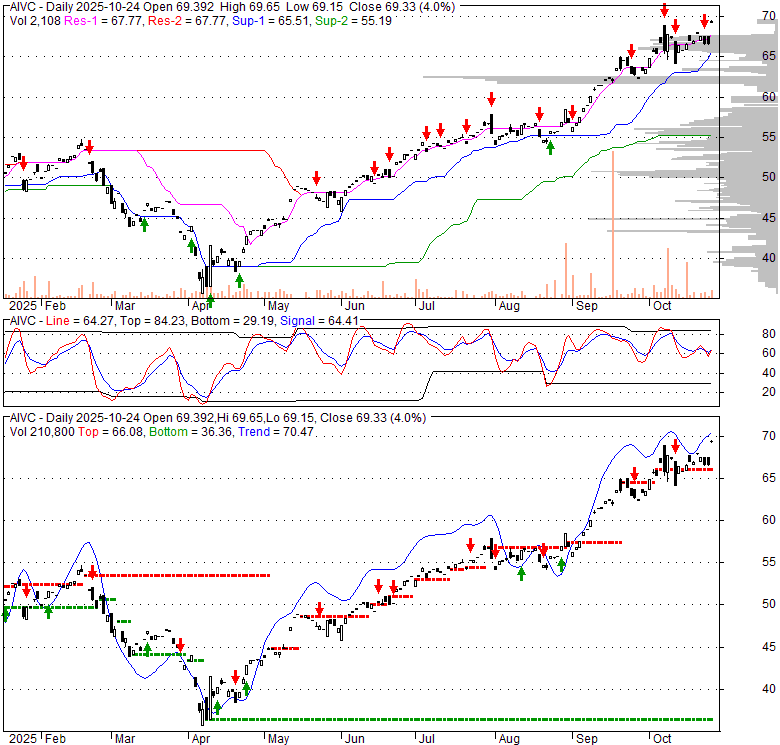
| 69.33 1.45 (2.14%) | 10-24 16:00 | |||||||||||||
|
|
| Short term | ||||
| Mid term | |
|||
| Targets | 6-month : | 81.35 |
1-year : | 95.01 |
| Resists | First : | 69.65 |
Second : | 81.35 |
| Pivot price | 66.86 |
|||
| Supports | First : | 65.15 |
Second : | 62.36 |
| MAs | MA(5) : | 67.62 |
MA(20) : | 66.28 |
| MA(100) : | 57.74 |
MA(250) : | 51.78 |
|
| MACD | MACD : | 1.5 |
Signal : | 1.6 |
| %K %D | K(14,3) : | 66 |
D(3) : | 64.9 |
| RSI | RSI(14): 66.3 |
|||
| 52-week | High : | 69.65 | Low : | 35.68 |
Price has closed above its short-term moving average. Short-term moving average is currently above mid-term; and above long-term moving average. From the relationship between price and moving averages: This stock is BULLISH in short-term; and BULLISH in mid-long term.[ AIVC ] has closed Bollinger Bands are 2.2% narrower than normal. The current width of the bands does not suggest anything about the future direction or movement of prices.
| If tomorrow: | Open lower | Open higher |
| High: | 69.71 - 69.98 | 69.98 - 70.29 |
| Low: | 68.41 - 68.7 | 68.7 - 69.04 |
| Close: | 68.79 - 69.26 | 69.26 - 69.79 |
AIVC provides exposure to a narrow portfolio consisting of 45 leading companies tied to the cloud and AI ecosystems. The strategy groups the ecosystem into three segments: cloud computing, AI hardware, and AI semiconductors that collectively power next-generation computing. Stock selection targets the top 15 companies within each segment based on market capitalization. Securities are then equally weighted. The index is reconstituted and rebalanced quarterly. The fund was restructured on April 7, 2020, having previously operated as ETFMG Drone Economy Strategy ETF under the ticker IFLY, tracking the Reality Shares Drone Index. It later traded as Wedbush ETFMG Global Cloud Technology ETF until January 29, 2024. Prior to October 14, 2024, the fund was named Amplify Global Cloud Technology ETF, traded under the ticker IVES, and tracked the Prime Global Cloud Technology Index.
Thu, 08 May 2025
5 Top-Ranked ETFs That Have Outperformed S&P 500 Since April Low - Yahoo Finance
Thu, 16 Jan 2025
Amplify ETFs Achieves Landmark $10 Billion in Assets Under Management - GlobeNewswire
Tue, 10 Dec 2024
Launch of New U.S. Treasury Covered Call Index Expands Bloomberg Indices’ Multi-Asset Offerings - Bloomberg.com
Tue, 10 Dec 2024
Launch of New U.S. Treasury Covered Call Index Expands Bloomberg Indices' Multi-Asset Offerings - 富途牛牛
Mon, 28 Oct 2024
AI investment heat remains strong, with major asset management giants rushing to seize opportunities through etf deployment. - 富途牛牛
Mon, 21 Oct 2024
Amplify ETF Adds AI Tilt to Cloud ETF - ETF.com
| Price to Book Value: P/BV, a ratio used to compare book value to its current market price, to gauge whether a stock is valued properly. |
Neutral |
| Price to Earnings: PE, the ratio for valuing a company that measures its current share price relative to its earnings per share (EPS). |
Neutral |
| Discounted cash flow: DCF, a valuation method used to estimate the value of an investment based on its expected future cash flows. |
Neutral |
| Return on Assets: ROA, indicates how profitable a company is in relation to its total assets, how efficiently uses assets to generate a profit. |
Neutral |
| Return on Equity: ROE, a measure of financial performance calculated by dividing net income by equity. a gauge of profitability and efficiency. |
Neutral |
| Debt to Equity: evaluate financial leverage, reflects the ability of equity to cover outstanding debts in the event of a business downturn. |
Neutral |

|
Exchange:
AMEX
|
|
|
Sector:
Financial Services
|
|
|
Industry:
Asset Management
|
|
| Shares Out | 0 (M) |
| Shares Float | 0 (M) |
| Held by Insiders | 0 (%) |
| Held by Institutions | 0 (%) |
| Shares Short | 0 (K) |
| Shares Short P.Month | 0 (K) |
| EPS | 0 |
| EPS Est Next Qtrly | 0 |
| EPS Est This Year | 0 |
| EPS Est Next Year | 0 |
| Book Value (p.s.) | 0 |
| Profit Margin | 0 % |
| Operating Margin | 0 % |
| Return on Assets (ttm) | 0 % |
| Return on Equity (ttm) | 0 % |
| Qtrly Rev. Growth | 0 % |
| Gross Profit (p.s.) | 0 |
| Sales Per Share | 0 |
| EBITDA (p.s.) | 0 |
| Qtrly Earnings Growth | 0 % |
| Operating Cash Flow | 0 (M) |
| Levered Free Cash Flow | 0 (M) |
| PE Ratio | 0 |
| PEG Ratio | 0 |
| Price to Book value | 0 |
| Price to Sales | 0 |
| Price to Cash Flow | 0 |
| Dividend | 0 |
| Forward Dividend | 0 |
| Dividend Yield | 0% |
| Dividend Pay Date | Invalid DateTime. |
| Ex-Dividend Date | Invalid DateTime. |