
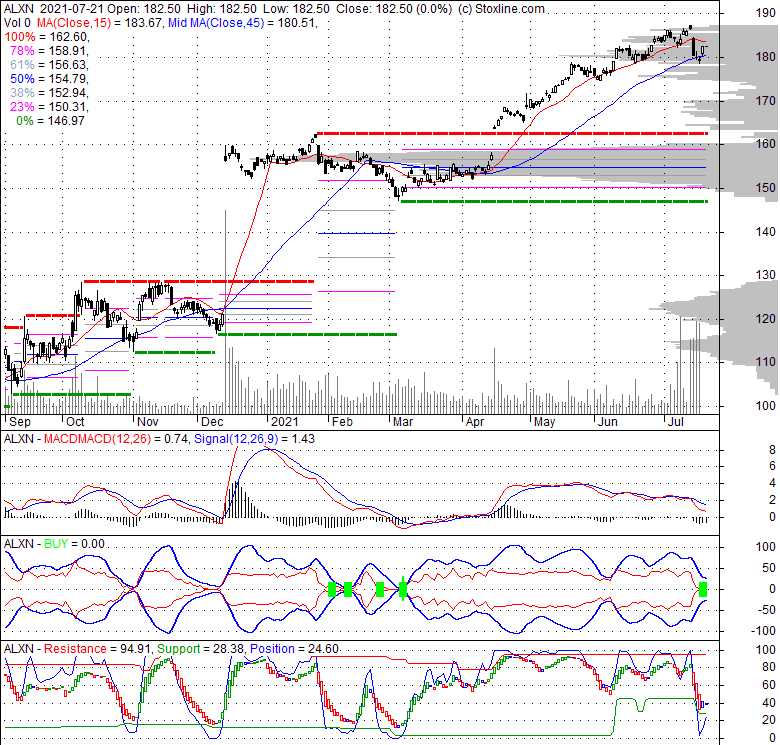
| 182.5 0 (0%) | 04-24 15:47 | |||||||||||||
|
|
| Short term |  |
|||
| Mid term | |
|||
| Targets | 6-month : | 1-year : | ||
| Resists | First : | Second : | ||
| Pivot price | ||||
| Supports | First : | Second : | ||
| MAs | MA(5) : | MA(20) : | ||
| MA(100) : | MA(250) : | |||
| MACD | MACD : | Signal : | ||
| %K %D | K(14,3) : | D(3) : | ||
| RSI | RSI(14): | |||
| 52-week | High : | Low : | ||
| If tomorrow: | Open lower | Open higher |
| High: | - | - |
| Low: | - | - |
| Close: | - | - |
Alexion Pharmaceuticals, Inc. is a biopharmaceutical company focused on the development and commercialization of a diverse range of therapeutic solutions. The company's established product portfolio features ULTOMIRIS (ALXN1210/ravulizumab-cwvz), a C5 inhibitor approved for paroxysmal nocturnal hemoglobinuria (PNH) and atypical hemolytic uremic syndrome (aHUS). Another key offering is SOLIRIS (eculizumab), a monoclonal antibody addressing a broader range of conditions including PNH, aHUS, generalized myasthenia gravis (gMG), and neuromyelitis optica spectrum disorder (NMOSD). Beyond these, the company markets Strensiq (asfotase alfa), a specialized enzyme replacement therapy for individuals with hypophosphatasia, and Kanuma (sebelipase alfa), indicated for lysosomal acid lipase deficiency. Alexion also maintains a robust development pipeline, featuring several promising candidates: Phase III clinical trials: ALXN1210 (intravenous formulation) for gMG and NMOSD; ALXN1210 (subcutaneous formulation) for PNH and aHUS; and ALXN1840 (WTX101) for Wilson disease. Phase I clinical trials: ALXN1810 (subcutaneous) targeting renal diseases; ALXN1720 (subcutaneous) for conditions characterized by dysregulated terminal complement activity; and ALXN1830 and ABY-039, both focused on the neonatal Fc receptor pathway. The company distributes its therapies to a broad network of healthcare stakeholders, including distributors, pharmacies, hospitals, and hospital buying groups, reaching patients both within the United States and across international markets. To bolster its research and development efforts and expand its reach, Alexion engages in various strategic alliances and collaborations. These include a collaboration and license agreement with Halozyme Therapeutics, Inc.; collaborations with Caelum Biosciences, Inc., Dicerna Pharmaceuticals, Inc., and Zealand Pharma A/S; a strategic agreement also with Caelum Biosciences, Inc.; an agreement with Stealth BioTherapeutics Corp.; and a partnership with Affibody AB. Established in 1992, the company maintains its corporate headquarters in Boston, Massachusetts.
Mon, 12 Jul 2021
The Alexion Pharmaceuticals (NASDAQ:ALXN) Share Price Is Up 74% And Shareholders Are Holding On - Yahoo Finance
Sat, 01 May 2021
Document - SEC.gov
Thu, 04 Feb 2021
Document - SEC.gov
Mon, 14 Dec 2020
What's behind AstraZeneca's US$39bn deal for Alexion Pharmaceuticals? - Proactive Investors
Sun, 13 Dec 2020
Why AstraZeneca (AZN) Is Buying Alexion (ALXN) For $39 Billion - Pulse 2.0
Tue, 05 May 2020
Alexion to Acquire Portola - Business Wire
| Price to Book Value: P/BV, a ratio used to compare book value to its current market price, to gauge whether a stock is valued properly. |
Outperform |
| Price to Earnings: PE, the ratio for valuing a company that measures its current share price relative to its earnings per share (EPS). |
Outperform |
| Discounted cash flow: DCF, a valuation method used to estimate the value of an investment based on its expected future cash flows. |
Outperform |
| Return on Assets: ROA, indicates how profitable a company is in relation to its total assets, how efficiently uses assets to generate a profit. |
Neutral |
| Return on Equity: ROE, a measure of financial performance calculated by dividing net income by equity. a gauge of profitability and efficiency. |
Neutral |
| Debt to Equity: evaluate financial leverage, reflects the ability of equity to cover outstanding debts in the event of a business downturn. |
Outperform |
|
Exchange:
NASDAQ
|
|
|
Sector:
Healthcare
|
|
|
Industry:
Biotechnology
|
|
| Shares Out | 0 (M) |
| Shares Float | 0 (M) |
| Held by Insiders | (%) |
| Held by Institutions | (%) |
| Shares Short | 0 (K) |
| Shares Short P.Month | 0 (K) |
| EPS | |
| EPS Est Next Qtrly | |
| EPS Est This Year | |
| EPS Est Next Year | |
| Book Value (p.s.) | |
| Profit Margin | % |
| Operating Margin | % |
| Return on Assets (ttm) | % |
| Return on Equity (ttm) | % |
| Qtrly Rev. Growth | % |
| Gross Profit (p.s.) | |
| Sales Per Share | |
| EBITDA (p.s.) | |
| Qtrly Earnings Growth | % |
| Operating Cash Flow | 0 (M) |
| Levered Free Cash Flow | 0 (M) |
| PE Ratio | |
| PEG Ratio | |
| Price to Book value | |
| Price to Sales | |
| Price to Cash Flow |
| Dividend | |
| Forward Dividend | |
| Dividend Yield | 0% |
| Dividend Pay Date | |
| Ex-Dividend Date |

|

|
|

|
|
|
|
|
|