| 0 (0%) | 04-25 20:27 | |||||||||||||
|
|
| Short term | |
|||
| Mid term | ||||
| Targets | 6-month : | 275.7 | 1-year : | 295.99 |
| Resists | First : | 236.04 | Second : | 253.41 |
| Pivot price | 220.23 |
|||
| Supports | First : | 207.94 | Second : | 173.01 |
| MAs | MA(5) : | 215.03 |
MA(20) : | 224.53 |
| MA(100) : | 210.12 |
MA(250) : | 189.39 |
|
| MACD | MACD : | -4.3 |
Signal : | -3.4 |
| %K %D | K(14,3) : | 30.7 |
D(3) : | 25.9 |
| RSI | RSI(14): 43.1 |
|||
| 52-week | High : | 253.41 | Low : | 133.83 |
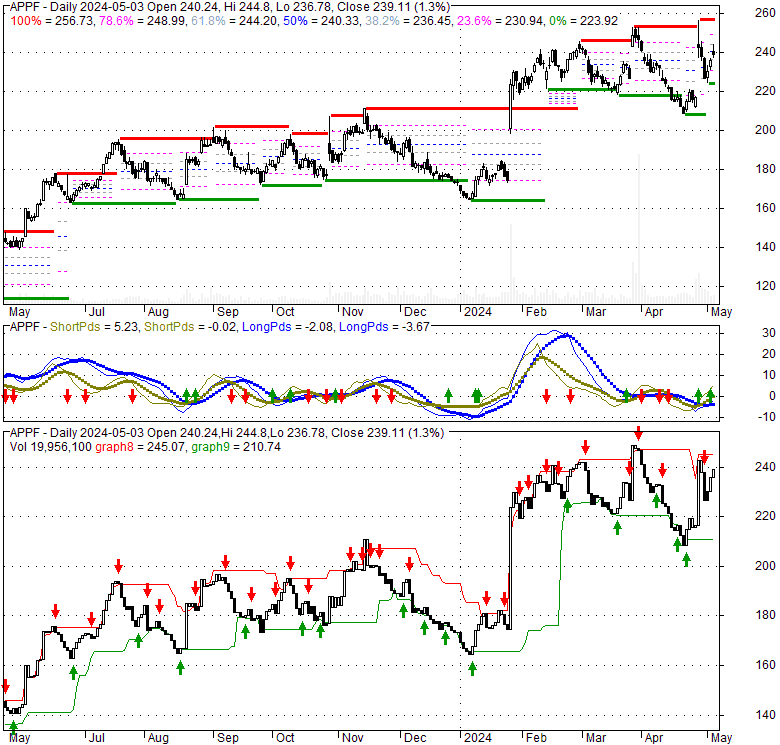
Price has closed above its short-term moving average. Short-term moving average is currently below mid-term; and above long-term moving average. From the relationship between price and moving averages: This stock is NEUTRAL in short-term; and NEUTRAL in mid-long term.[ APPF ] has closed above bottom band by 38.0%. Bollinger Bands are 8.1% narrower than normal. The current width of the bands does not suggest anything about the future direction or movement of prices.
| If tomorrow: | Open lower | Open higher |
| High: | 218.06 - 219.09 | 219.09 - 220.06 |
| Low: | 208.67 - 209.86 | 209.86 - 210.97 |
| Close: | 214.69 - 216.57 | 216.57 - 218.32 |
Thu, 25 Apr 2024
DPM Bečić attends APF's Parliamentary Affairs Committee meeting - Vlada Crne Gore - GOV.ME
Wed, 24 Apr 2024
How To Watch The 2024 APF Asian Equipped Powerlifting Championships - BarBend
Wed, 24 Apr 2024
APF Canada Announces 2024-25 John H. McArthur Research Fellows - Asia Pacific Foundation of Canada
Thu, 18 Apr 2024
Discover the APFC (APF Coin) Listing on XT.COM - GlobeNewswire
Tue, 16 Apr 2024
APF invests in $631M CMBS hotel refi - Hotel Business
Thu, 25 Jan 2024
APF to unveil new humane dog housing space - NEWS10 ABC
| Price to Book Value: P/BV, a ratio used to compare book value to its current market price, to gauge whether a stock is valued properly. |
Neutral |
| Price to Earnings: PE, the ratio for valuing a company that measures its current share price relative to its earnings per share (EPS). |
Neutral |
| Discounted cash flow: DCF, a valuation method used to estimate the value of an investment based on its expected future cash flows. |
Neutral |
| Return on Assets: ROA, indicates how profitable a company is in relation to its total assets, how efficiently uses assets to generate a profit. |
Neutral |
| Return on Equity: ROE, a measure of financial performance calculated by dividing net income by equity. a gauge of profitability and efficiency. |
Neutral |
| Debt to Equity: evaluate financial leverage, reflects the ability of equity to cover outstanding debts in the event of a business downturn. |
Neutral |
|
Exchange:
|
|
|
Sector:
|
|
|
Industry:
|
|
| Shares Out | 22 (M) |
| Shares Float | 20 (M) |
| Held by Insiders | 7.2 (%) |
| Held by Institutions | 81.3 (%) |
| Shares Short | 756 (K) |
| Shares Short P.Month | 642 (K) |
| EPS | 0.05 |
| EPS Est Next Qtrly | 0 |
| EPS Est This Year | 0 |
| EPS Est Next Year | 0 |
| Book Value (p.s.) | 8.28 |
| Profit Margin | 0.4 % |
| Operating Margin | 7.7 % |
| Return on Assets (ttm) | 1.3 % |
| Return on Equity (ttm) | 0.9 % |
| Qtrly Rev. Growth | 38.5 % |
| Gross Profit (p.s.) | 0 |
| Sales Per Share | 28.52 |
| EBITDA (p.s.) | 0.73 |
| Qtrly Earnings Growth | 0 % |
| Operating Cash Flow | 60 (M) |
| Levered Free Cash Flow | 64 (M) |
| PE Ratio | 3610.83 |
| PEG Ratio | 2.2 |
| Price to Book value | 26.13 |
| Price to Sales | 7.59 |
| Price to Cash Flow | 78.17 |
| Dividend | 0 |
| Forward Dividend | 0 |
| Dividend Yield | 0% |
| Dividend Pay Date | Invalid DateTime. |
| Ex-Dividend Date | Invalid DateTime. |

|

|
|

|
|
|
|
|
|